June 10, 2014

Risk Analysis In The Golden Age Of The Central Banker

A brief note today on what might be an arcane subject for some but is a great example of the most basic question in risk management – are you thinking about your risk questions in a way that fits the fundamental nature of your data? Do you understand the fundamental nature of your data? Our business incentivizes us to build complex and ingenious models and data analysis systems in order to generate an edge or dodge a bullet. But are we building our elaborate mental constructs on solid ground? Or on quicksand?

I’ve spent a lot of time recently talking with clients about measuring market risk across a wide range of asset classes and securities as part of an adaptive investment strategy, and I get a lot of smart questions. One of the best was deceptively simple – what do you think about using implied volatility to measure risk? – and that’s the question I want to use to illustrate a larger point.

First let’s unpack the question. Volatility is a measurement of how violently the returns of a security jump around, and in professional investment circles the word “volatility” is typically used as shorthand for risk – the higher the volatility, the greater the embedded risk. There are some valid concerns and exceptions to this conflation of the two concepts, but by and large I think it’s a very useful connection.

Within the general concept of volatility there are two basic ways of measuring it. You can look backwards at historical prices over some time period to figure out how violently those prices actually jumped around – what’s called “realized volatility” – or you can look forward at option prices for that same security and figure out how violently investors expect that prices will jump around in the future – what’s called “implied volatility”. Both flavors of volatility have important uses, even though they mean something quite different. For example, a beta measurement (how much a security’s price moves relative to an underlying index) is based on realized volatility. On the other hand, the VIX index – the most commonly reported gauge of overall market risk or complacency – is entirely based on the implied volatility of short to medium-term options on the S&P 500.

The big drawback to using realized or historical volatility is that it is, by nature, backwards looking. It tells you exactly where you’ve been, but only by extrapolation provides a signal for where you are going. In a business where you always want to be looking forward, this is a problem. Using realized volatility means that you will always be reacting to changes in the broad market characteristics of your portfolio; you will never be proactive to looming changes that might well be embedded within the “wisdom of the crowd” as found in forward-looking options prices. If you’re relying on realized volatility, no matter how sensitively or smartly you set the timing parameters, you will always be late. This was the point of the smart question I was asked: isn’t there useful information in the risk expectations of market participants, information that allows you to be proactive rather than reactive … and shouldn’t you be using that information as you seek to balance risk across your portfolio?

My answer: yes … and no. Yes, there is useful information in implied volatility for many purposes. But no, not for the purpose of asset allocation. Why not? Because we are living in the Golden Age of Central Bankers, and that wreaks havoc on the fundamental nature of market expectations data.

Here’s an example I’ve used before to illustrate this point, courtesy of Ed Tom and the Credit Suisse derivatives strategy group. Figures 1 shows the term structure (implied price level at different future times based on prices paid for options) of the VIX index on October 15th, 2012.

If you recall, there was great consternation regarding the Fiscal Cliff at this time, not to mention the uncertainty surrounding the November elections. That consternation and uncertainty is reflected in the term structure, as it is much steeper than is typical for a spot VIX level of 15, indicating that the market is anticipating S&P 500 volatility to be progressively higher to an unusual degree from January 2013 onwards. The way to read this chart is that the market expects a VIX level of 18 three months in the future (January 15), 19 three and a half months in the future (January 31), 20 four months in the future (February 15), and so on. All of these results are higher than one would typically expect for future expectations of the VIX from this starting point (essentially flat at 17).

Now take a look at Figure 2, which shows the Credit Suisse estimation of the underlying distribution of VIX expectations for January 31, 2013.

The way to read this chart is that a lot of market participants have a Bullish view (low VIX) for what the world will look like on January 31, with a peak frequency (greatest number of bullish contracts) at 15 and a fairly narrow distribution of expectations around that. Another group of market participants clearly have a Bearish view (high VIX) of the world on January 31, with a peak frequency around 24 and a fairly broad distribution around that.

So what’s the problem? The problem is that Figure 1, which is what you would come up with based on public options data, says that the most likely implied price for the VIX on January 31, 2013 is 19. But Figure 2, which is based on the trading data that Credit Suisse collects, says that a VIX level of 19 is the least likely outcome. What Figure 2 tells you is that almost no one expects that the outcome will end up in the middle at a price of 19, even if that is the average implied price of all the exposures.

Usually the average implied price of a security is also the most likely estimated price outcome of the security. That is, if options on a security imply an average price of 19 a few months from now, exposures will generally form some sort of bell curve centered on the price of 19. The most common estimation of the price would be 19, with fewer people estimating a higher price and fewer people estimating a lower price. But in those situations – like expectations of future VIX levels on October 15, 2012 – where there’s not a single-peaked distribution, all of our math and all of our models and all of our intuitively held assumptions go right out the window.

Unfortunately, these bi-modal market expectation structures are now the rule rather than the exception in this, the Golden Age of the Central Banker. Why? Because monetary policy since March, 2009 has explicitly established itself as an emergency bridge for financial markets, a bridge between the real world of an anemic, under-employed, under-utilized economy and the hoped-for world of a vibrantly growing, robust economy. On its own terms, this has been an entirely successful experiment, I suspect surpassing the wildest dreams of Bernanke et al. Stock markets have been “bridged”, reflecting what the world would look like if the global economy were off to the races, while bond markets reflect what the world actually looks like with the global economy sputtering in fits and starts. The problem today is that the experiment has been too successful. Whether you are in Europe or the US or Japan or China or wherever, the only investment questions that matter are whether central banks will continue their emergency monetary policies and what happens if the bridges are removed. These are not small, incremental policy questions. These are existential questions, reflecting binary expectations of the world with an enormous chasm in-between. With a hat tip to Milton Friedman, we are all bi-modal now.

So what’s the moral of this story for portfolio management? There are four, I believe.

In the Golden Age of the Central Banker …

1) the VIX is not a reliable measure of market complacency. Remember that the VIX itself is an implied volatility construct, built on the prices paid for options on the S&P 500 two to three months in the future. We assume that whatever the VIX is reported to be, that’s the consensus market expectation, with a lot of people holding that particular view and progressively fewer people on either side of that number. This is not necessarily the case, and when binary events raise their ugly heads it is almost certainly not the case. A low VIX level might indicate a complacent market, or it might indicate two sets of investors – one very complacent and one non-complacent – who see the world entirely differently. You have no idea what the underlying market expectations look like, and this makes all the difference in determining what the VIX means.

2) the wisdom of crowds is nonexistent. I believe in the efficiency of emergent behaviors. I believe that there is a logical dynamic process to crowd behaviors. But I also believe that crowds are extremely malleable when confronted by powerful individuals or institutions that understand the strategic interaction of crowds and make a concerted effort to master the game. There’s no inherent “wisdom” here, no emergent outcome where the crowd acts like an enormous set of parallel microprocessors to arrive at Truth with a capital T. The Common Knowledge Game is controlled by the Missionary, and our current Missionaries – central bankers, politicians, famous investors and media mouthpieces – know it.

3) fundamental risk/reward calculations for directional exposure to any security are problematic on anything other than a VERY long time horizon. Game-playing has always been a big part of the market environment, and it dominates successful directional bets on a very short time horizon. Similarly, stock-picking on a fundamental basis has always been a big part of the market environment and dominates successful directional bets on a very long time horizon. Between the very short-term and the very long-term you have this mish-mash of game-playing and stock-picking. One impact of the pervasiveness of the Common Knowledge Game today is that it pushes out the time horizon on which stock-picking on a fundamental basis can really shine. If you’re in the stock-picking business the value of permanent capital has never been greater.

4) I’d rather be reactive and right in my portfolio than proactive and wrong. I started this note with an acknowledgment of the weakness of risk assessments based on realized or historical volatility – it’s inherently backwards looking and you will always, no matter how finely calibrated your system, be late to respond to changing market conditions. But here’s the thing. This is what it means to be adaptive. You can’t be adaptive without something to adapt TO. Will you miss the market turns? Will you occasionally get whipsawed in your reactive process? Without a doubt. But you won’t get killed. You won’t be on the wrong side of a binary bet that you really didn’t need to make. You won’t discover that your pretty little sand box is really filled with quicksand. The Golden Age of the Central Banker is a time for survivors, not heroes. And that’s the real moral of this story.

June 9, 2014

IMF's Lagarde – Perpetuating Untruths on a Massive Scale?

'Do I have to go on my knees?': grovelling apology from IMF head for incorrect warnings on UK economy ... Head of the International Monetary Fund, Christine Lagarde, accepts her organisation's low growth forecasts for the UK economy were wrong ... Christine Lagarde has asked whether she needs to grovel on her knees before George Osborne over the IMF's incorrect warnings on the UK economy, as she warned against raising taxes. – UK Telegraph 

Dominant Social Theme: The IMF has underestimated Britain's resilience and should be ashamed. 

Free-Market Analysis: If Britain's economy is improving, it's due to monetary stimulation not natural causes. Ms. Christine Lagarde ought to comment on the mechanism of "economic improvement," but she won't. 

She should comment on it because the kind of low-interest, high-money printing approach of the Bank of England is merely guaranteeing another recession/depression eventually ... even sooner rather than later. 

She could comment on the reality of how modern economies work because the kind of monopoly money printing that is common throughout the world impoverishes more than it enriches and creates an ever-expanding underclass. 

The US has been exposed to central bank money printing for a century and the results are not good, as reported over and over in the mainstream media: some 50 million, today, are on food stamps; at least an equal number are on some sort of other government handout; some 20 to 30 percent can't find fulltime employment. 

But none of this is present in Ms. Lagarde's analysis. She merely apologizes for doubting the "prosperity" the system produces. 

Here's more: 

Ms Lagarde said tax rises are "not recommendable". The growth the UK is enjoying now has "resulted" from George Osborne's policies, she said. The growth now appears to be "pretty sustainable" because it is being driven by private sector investment as well as households consuming more. ... 

"We got it wrong," Ms Lagarde told the Andrew Marr Show. "We acknowledged it. Clearly the confidence building that has resulted from the economic policies adopted by the government has surprised many of us." 

"We said very clearly that we had underestimated growth for the U.K. and that our forecasts had been proven wrong by the reality of economic developments," she said. 

Pressed on whether she had apologised to Mr Osborne for the incorrect forecasts, she said: "Do I have to go on my knees?" Mrs Lagarde rejected calls from the European Commission for higher taxes. 

"The mixture between tax and spending cuts is something that we regard as fairly balanced and at the right mix. We don't see a massive increase in tax as recommendable at the moment." 

The two chief risks to the economy are low productivity and rising house prices, but houses are not yet a bubble, she said. Ms Lagarde dismissed speculation she could be the next president of the European Commission, saying: "The only position that has not been debated for me has been the Vatican." 

There is much in the above statements that misses the mark. Ms. Lagarde believes that UK "growth" is the result of government interventions. She also believes such growth is sustainable because it is being generated by private sector investment. 

But UK growth is actually the result of ferocious money printing and the participation of the private sector in an economy manipulated by monopoly money printing is NOT a positive development. As free-market economists have pointed out for over half-a-century now, monopoly central bank facilities inevitably overproduce currency and eventually the private sector is "fooled" into becoming active again. 

But the activity of the private sector is inevitably going to fail because it is based on false monetary signals. In reality, there is no recovery, only turgid surges of currency. Worse still, central bank "supermoney" is distributed via commercial banks that are often constrained by central bank policies from lending too aggressively. 

The result is that the money doesn't initially find its way to the industrial sector where it might stimulate employment but ends up in securities marts and bids them up. 

When markets – stock markets especially – go up, excess capital often finds its way into high-end goods, and most notably real estate. 

And of course, that's what is happening in Britain right now. Ms. Largarde is well aware of it, and the article above even quotes her as dismissing these concerns. 

"Houses are not yet in a bubble," she is quoted as saying. But even this tepid endorsement of housing health is strange, as it seems to acknowledge that housing WILL become subject to yet another weary mania at some point. 

 Ms. Lagarde is not telling the truth about modern monetary cycles and she is certainly not telling the truth about Britain's new housing bubble. 

Here's an excerpt from a recent Guardian article entitled, "Britain's economy is dangerously imbalanced – just look at the London property bubble."

In its contemporary history, there has never been such a stark divide between London's property market and the rest of Britain. Adam Leaver at Manchester Business School has graphed the average house price in London against the average price outside London going back to the start of 1995. 

What he's found is gobsmacking: while homes in London have always been pricier than the rest of the UK, they've never been relatively as expensive as this. Your average home in London now costs as much as three homes in the rest of Britain. Such a disparity has never been seen before, from John Major through to Gordon Brown.

If Ms. Lagarde is not telling the truth, then what is she doing? We'd suggest she's playing her part in promoting a larger elite dialectic. 

She could explain how modern capitalism really works. She could even – as we have – explain that stock markets might present opportunities (at least in the near term) because large, Western banks are determined to continue to stimulate. In aggregate this constitutes a meme we call the Wall Street Party. 

She could have justified her previous position by explaining how the system really works. She could have explained that the current "prosperity" is ephemeral. She could have explained why her statement about British economic weakness was largely true. 

But to do that, she'd have had to expose the reality of the system that the IMF itself is part of. And she'd have had to admit that the system is much more apt to produce centralized control than a real expansion of wealth. 

Instead, she apologized for being "wrong." Central bank monopoly money printing had worked better and faster than she'd expected. That was the gist of her admission. 

It is a false admission. But this is the way that the modern monetary dialectic perpetuates itself. And as a prime exponent of the current system, she surely could not have said something else and expect to keep her position. 

Instead, she admitted she was wrong when she was not. She then claimed Britain was not subject to a high-end property bubble when it is. Presumably, over time, IMF monetary policy will reflect these misstatements among others. 

Conclusion So "directed history" – the product of such untruths on a massive scale – perpetuates itself. 

June 6, 2014

US Foreign Wealth Confiscation Begins Under the Code Names FinCen, FATCA and FBAR

We have been reporting on how the US government is using very nefarious and egregious methods on tracking its own citizen's financial information, fining them and even instituting the Foreign Account Tax Compliance Act (FATCA) as a form of subterfuge capital controls which is closing off international banking to Americans (as we reported yesterday in Mexico).

FinCen, the Financial Crimes Enforcement Network, has, in essence, been making nearly any international transfers of money viewed as a criminal activity.  FATCA has been making it harder and harder for Americans to open international bank accounts.  And FBAR, the Report of Foreign Bank and Financial Accounts, has made it a highly punishable offense for any American with a foreign account worth over $10,000 if they do not file an FBAR each year.

The problem with FBAR is that countless Americans with foreign accounts and US expats are completely unaware of its existence.  And, despite the fact that there are literally tens of thousands of rules in the US tax code for things like this, ignorance of its requirement is not excusable.

We have stated in the past that FinCen, FATCA and FBAR are all intermingled to essentially put in capital controls on the US populace and, as well, steal most of the money from those with funds abroad.  In the past many said that we were being too alarmist and surely the US government would not do something like this.
Well, think again, it just happened.  And it was even worse than we thought.

CARL ZWERNER JUST GOT FBAR'ED
In a court decision just released a man who ignorantly did not file an FBAR had not only all of his funds seized by the US government but, unbelievably, even more than he had in his account. 

Carl Zwerner, an 87-year old Florida man, must pay the US government a 150% penalty on the value of his Swiss bank account, amounting to the biggest penalty by percentage on record, according to his lawyer. Carl Zwerner will pay more than $2 million "for willfully failing to file a US Treasury form called a Report on Foreign Bank and Financial Accounts, or FBAR. Prosecutors and the Internal Revenue Service use FBAR penalties, which sometimes are worse than criminal fines, in order stamp out "offshore tax evasion."

As we've discussed in The Dollar Vigilante Blog, individuals have flocked to the IRS amnesty program which purports to allow holders of undeclared offshore accounts avoid prosecution. Over 43,000 Americans have joined the program since 2009, shelling out $6 billion to the US. 

In Zwerner's case, the IRS sought to seize 50% of the value of his account compounded over each of four years where he was deemed in non-compliance. With Zwerner's case a new precedent has been set. “As this jury verdict shows, the cost of not coming forward and fully disclosing a secret offshore bank account to the IRS can be quite high,” Kathryn Keneally, the head of the tax division, said in the statement.

They can get 50 percent for the non-filing of one piece of paper, and 200 percent for the non-filing of four pieces of paper,” Zwerner's lawyer Martin Press said in a phone interview. “The question is whether such a massive penalty is appropriate for simply a disclosure form which carries no tax.”

Zwerner's Swiss account at ABN Amro Group NV, the Netherlands’ third-biggest bank, was valued at $1.48 million in 2004, when his FBAR penalty was $723,762; the value in 2005 was $1.49 million, when the penalty was $745,209; and the value in 2006 was $1.55 million, and a $772,838 penalty. The total penalties were $2.24 million.

Many naysayers said that the US government would not come after the total value of an account deemed in non-compliance.  In a sense they were right... the US government came for nearly double the amount held in the account!
But Zwerner's isn't the biggest FBAR penalty in terms of size on record. H. Ty Warner, the billionaire founder of Beanie Babies, pleaded guilty last year on evading taxes on secret Swiss accounts that held as much as $107 million. He paid an FBAR penalty of $53.6 million.  Although, compared to Zwerner, he got off easy with only 50% of his funds stolen.

Mary Estelle Curran, a 79-year-old widow from Palm Beach, Florida, pleaded guilty last year for not disclosing $43 million at UBS AG. (UBSN) She paid a $21.6 million FBAR penalty.  Ms. Curran fell for the IRS's "limited-amnesty program" in 2009, where they said they would not fine her if she came forward. But the agency simply rejected her and fined her anyway.  In her case it is even worse as she was indicted in late 2011 and faced up to 37 months in prison. 

Zwerner testified, telling jurors that he tried to enter the IRS voluntary disclosure program, and that he didn’t know until 2008 that he must file FBARs. “Zwerner’s original tax returns for 2004 to 2007 didn’t report any income from the Swiss bank account,” reads a US complaint filed in June 2013. “The first time he reported such income was when he amended those returns.”

He failed to declare interest on his foreign account. The account was opened in the 1960s, and was held in the name of two foundations, according tot he Justice Department. “Zwerner was able to use the proceeds of the account whenever he wanted and used it for personal expenses, including European vacations,” the department said.

A TIME OF GREAT RISK... AND A TIME OF GREAT OPPORTUNITY

It can seem like there are no options for hardworking Americans, that the nation has reached that point which Ayn Rand predicted where the most productive would stop working simply because it paid more to do nothing. Even if you do work your whole life, you might be thinking, the government will ultimately come one day and take it all away. 

This does not have to be the case. There are still many options available, but the landscape is quickly changing and in order to get the right advice you'll need a highly informed and nimble team such as the one at TDV Wealth Management (TDVWM) where we advise the countless Americans who have been caught up in this extortion dragnet.  And you can stay informed with The Dollar Vigilante (TDV) Newsletter.  TDV has been ahead of the curve advising people to internationalize their precious metals (Getting Your Gold Out Of Dodge), been early into the importance of bitcoin in protecting your assets and advising Americans to get a second passport.

On the bright side, although the news and information can be depressing, there are countless things to be excited about and a plethora of opportunities to not only survive the coming collapse of the West but to prosper. The End Of the Monetary System As We Know It (TEOTMSAWKI) will be a time of Great Transformation. If you remain open-minded, relaxed, well informed and focused you could actually do better than you even thought possible ... but it is going to mean taking personal responsibility in how to navigate the coming collapse.

Your government registered financial advisor will likely not know and/or tell you about what is going on.  Take responsibility for your own personal and financial future.

Through taking control and paying attention to what is going on you will be positioned for a period of great change and opportunity.  If not you may get FBAR'ed like Carl Zwerner.
It's really that simple.

Source

June 5, 2014

Half The Country Makes Less Than $27,520 A Year And 15 Other Signs The Middle Class Is Dying

If you make more than $27,520 a year at your job, you are doing better than half the country is.  But you don't have to take my word for it, you can check out the latest wage statistics from the Social Security administration right here.  But of course $27,520 a year will not allow you to live "the American Dream" in this day and age.  After taxes, that breaks down to a good bit less than $2,000 a month.  You can't realistically pay a mortgage, make a car payment, afford health insurance and provide food, clothing and everything else your family needs for that much money.  That is one of the reasons why both parents are working in most families today.  In fact, sometimes both parents are working multiple jobs in a desperate attempt to make ends meet.  Over the years, the cost of living has risen steadily but our paychecks have not.  This has resulted in a steady erosion of the middle class.  Once upon a time, most American families could afford a nice home, a couple of cars and a nice vacation every year.  When I was growing up, it seemed like almost everyone was middle class.  But now "the American Dream" is out of reach for more Americans than ever, and the middle class is dying right in front of our eyes.

One of the things that was great about America in the post-World War II era was that we developed a large, thriving middle class.  Until recent times, it always seemed like there were plenty of good jobs for people that were willing to be responsible and work hard.  That was one of the big reasons why people wanted to come here from all over the world.  They wanted to have a chance to live "the American Dream" too.

But now the American Dream is becoming a mirage for most people.  No matter how hard they try, they just can't seem to achieve it.

And here are some hard numbers to back that assertion up.  The following are 15 more signs that the middle class is dying...

#1 According to a brand new CNN poll, 59 percent of Americans believe that it has become impossible for most people to achieve the American Dream...
The American Dream is impossible to achieve in this country. 
So say nearly 6 in 10 people who responded to CNNMoney's American Dream Poll, conducted by ORC International. They feel the dream -- however they define it -- is out of reach. 
Young adults, age 18 to 34, are most likely to feel the dream is unattainable, with 63% saying it's impossible. This age group has suffered in the wake of the Great Recession, finding it hard to get good jobs.
#2 More Americans than ever believe that homeownership is not a key to long-term wealth and prosperity...
The great American Dream is dying. Even though many Americans still desire to own a home, they are losing faith in homeownership as a key to prosperity.
Nearly two-thirds of Americans, or 64%, believe they are less likely to build wealth by buying a home today than they were 20 or 30 years ago, according to a survey sponsored by non-profit MacArthur Foundation. And nearly 43% said buying a home is no longer a good long-term investment.
#3 Overall, the rate of homeownership in the United States has fallen for eight years in a row, and it has now dropped to the lowest level in 19 years.

#4 52 percent of Americans cannot even afford the house that they are living in right now...
"Over half of Americans (52%) have had to make at least one major sacrifice in order to cover their rent or mortgage over the last three years, according to the “How Housing Matters Survey,” which was commissioned by the nonprofit John D. and Catherine T. MacArthur Foundation and carried out by Hart Research Associates. These sacrifices include getting a second job, deferring saving for retirement, cutting back on health care, running up credit card debt, or even moving to a less safe neighborhood or one with worse schools."
#5 According to the U.S. Census Bureau, only 36 percent of Americans under the age of 35 own a home.  That is the lowest level that has ever been measured.

#6 Right now, approximately one out of every six men in the United States that are in their prime working years (25 to 54) do not have a job.

#7 The labor force participation rate for Americans from the age of 25 to the age of 29 has fallen to an all-time record low.

#8 The number of working age Americans that are not employed has increased by 27 million since the year 2000.

#9 According to the government's own numbers, about 20 percent of the families in the entire country do not have a single member that is employed at this point.

#10 This may sound crazy, but 25 percent of all American adults do not even have a single penny saved up for retirement.

#11 As I noted in one recent article, total consumer credit in the United States has increased by 22 percent over the past three years, and 56 percent of all Americans have "subprime credit" at this point.

#12 Major retailers are shutting down stores at the fastest pace that we have seen since the collapse of Lehman Brothers.

#13 It is hard to believe, but more than one out of every five children in the United States is living in poverty in 2014.

#14 According to one recent report, there are 49 million Americans that are dealing with food insecurity right now.

#15 Overall, the U.S. poverty rate is up more than 30 percent since 1966.  It looks like LBJ's war on poverty didn't work out too well after all.

Sadly, it does not appear that there is much hope on the horizon for the middle class.  More good jobs are being shipped out of the country and are being lost to technology every single day, and our politicians seem convinced that "business as usual" is the right course of action for our nation.

Unless something dramatic happens, it is going to become increasingly difficult to eke out a middle class existence as a "worker bee" in American society.  The truth is that most big companies these days do not have any loyalty to their workers and really do not care what ends up happening to them.

To thrive in this kind of environment, new and different thinking is required.  The paradigm of "go to college, get a job, stay loyal and retire after 30 years" has been shattered.  The business world is more unstable now than it has been during any point in the post-World War II era, and we are all going to have to adjust.

So what advice would you give to people that are struggling out there right now?  Please feel free to share your thoughts by posting a comment below...

June 4, 2014

Debunking the Myth of Private Equity’s Superior Returns

As readers no doubt have noticed, we’ve been drilling into the private equity industry of late, focusing more on investor issues than on the industry’s impact on companies, industries, and wage rates. Supposedly savvy limited partners being ripped off does, at first blush, appear to be far less pressing than buyout firms using financial engineering and cost cutting to reap mind-bogggling riches for the general partners’ top players, leaving the more than occasional bankrupt company in their wake.

Make no mistake: Private equity general partners are the biggest rentiers in the economy. They control large swathes of the real wealth of America, which is its companies. Yes, there is a sector of the industry that actually tries and for the most part does earn its returns by focusing on operating improvements in companies. These are businesses that are not managed professionally and need to implement better systems and procedures or add new capabilities to grow further. But these deals are on the mid to small end of the industry, generally topping out at acquisition sizes of $350 million. They represent a minority of total dollars committed to private equity.

And even these “better” operators still make use of leverage (although not as much as the financially-oriented buyers) and other tax strategies that reduce the tax bill of their investee companies to far lower levels than before the acquisition. In other words, their returns depend to a not-trivial degree on transfers from taxpayers to private equity investors.

So why our concern with the investor side? The power of the private equity industry rests on its access to investment dollars. Until limited partners question their rationales for investing in private equity, it continue to be difficult to curb the industry’s influence and activities. Remember all the criticism of Mitt Romney’s tenure as head of Bain Capital, including a devastating analysis of Bain deals by David Stockman? All that critical public scrutiny seems to have produced in the way of tangible outcomes is renewed demonstration of private equity’s overweening sense of entitlement, such as Tom Perkins’ widely-criticized letter to the Wall Street Journal in which he tried to depict criticism of the uber-rich as paving the road to “decadent ‘progressive’ thinking” and a new Kristallnacht.

The big reason for private equity’s untouchable status is that the overwhelming majority of its investors are convinced that private equity delivers better returns than any other strategy. That belief is largely intact despite disappointing returns post-crisis and a long-standing lack of any decent studies of overall private equity performance.

A must-read book new book on private equity, Private Equity at Work, by Eileen Appelbaum and Rosemary Batt, has made an exhaustive examination of the academic literature on numerous aspects of private equity, as well as examining important legal issues and providing numerous well-researched case studies. Their chapter on private equity returns is particularly troubling, and they’ve supplemented that with a new paper at the Center for Economic and Policy Research, part of a series related to their book.

Private equity, which consists of venture capital (about 15% of industry assets) and buyouts, is illiquid. Unlike investing in stocks, bonds, or even hedge funds, investors in private equity cede to the private equity general partners complete control of when they send in the money and when they get it back.

As Appelbaum and Batt point out in their book, private equity investors expect the strategy to earn 300 to 400 basis points more than the stocks, with the most common reference index the S&P 500, as compensation for private equity’s illiquidity. So notice that even on the investors’ own terms, if private equity delivers 300 to 400 basis points over the S&P 500, they are merely getting an adequate return for the risk they are taking. They are not getting a superior return. As we pointed out in a recent post:
Harvard has acknowledged that private equity has underperformed public stocks over the last decade before allowing for the illiquidity premium:
Harvard expects an “illiquidity premium” from private equity over public markets because of the long lock-up periods investors agree to, Mendillo [the Harvard Management CIO] said. “Over the last 10 years, however, our private equity and public equity portfolios have delivered similar results,” she said.
And keep in mind that illiquidity risk is real. Life insurers, which also have long-term investment horizons like pension funds (the biggest investor group in private equity), typically have much lower commitments. Why? State regulators and ratings agencies both restrict how much they can commit to illiquid investments. Remember, supposedly savviest of the savvy Harvard had Larry Summers blow a hole in its capital by making bad bets on interest rate swaps. Harvard had to scramble to meet its budget and cancelled projects and even ongoing student programs (no more hot breakfasts!) to deal with the fallout. Managing around illiquid private equity holdings made this difficult process even worse.

In addition, as we’ll discuss more in future posts, the private equity limited partnership agreements that we’ve published show that private equity capital calls (as in their demand that investors send money) have five-day required responses and draconian consequences for missing a capital call.

So what returns does private equity deliver? Astonishingly, for an investment strategy that has been in existence for over 30 years, no one has a good answer. As Appelbaum and Batt point out, there is no industry-wide data set of private equity performance. The fact that private equity firms continue to resist releasing the data necessary to analyze returns should in and of itself be a huge red flag.

Most studies have relied on cherry-picked data sets supplied by the private equity general partners. And even more rich, who has performed these studies? Almost without exception, finance professors who are members of business school faculties. Who are the biggest funders of business school endowments? At many schools, private equity firms. In other words, taking a critical stance towards the industry would not be a career-advancing move for a budding young scholar.

Even private-equity-industry-friendly McKinsey stated recently that they viewed only two studies of private equity returns as being reliable (conveniently, those papers confirmed that private equity does deliver that required 300 basis point premium over stocks). Appelbaum and Batt, who discuss the studies and their assessment of them in far more detail, have a more nuanced and generally dimmer view. This is the summary of their findings:
Because there is no publicly available or comprehensive data set on private equity, all studies of performance suffer from incompleteness and biases, and different methods of calculating returns lead to different results. But some methodologies and data sets are more credible than others. Reports that PE funds substantially outperform the stock market come almost entirely from industry sources that use the internal rate of return as a measure of performance. This measure is deeply flawed, for reasons examined in this chapter, and many finance scholars reject its use. Industry reports are also biased, as they rely on the data and methods of self-interested parties. 
Our review covers the most credible research by top finance scholars. They report much more modest returns to private equity funds, with some showing that the median fund does not beat the stock market and others showing that median returns are only slightly above the stock market. The most positive findings for private equity generally compare it to the S&P 500 and report that the median fund outperforms the S&P 500 by 1 percent and the average by 2 to 2.5%. According to these studies, the higher-than-average performance is driven by the top quartile of funds – and particularly the top decile. With the exception of these top performing funds, returns do not cover the roughly 3 percent additional returns that investors typically calculate as required to compensate them for the added risk and illiquidity of private equity investments.
This assessment is more deadly than it sounds. As a finance professional who has spent a lot of my career performing valuations, I find the fact that private equity investors have been conned into relying on internal rate of return as a performance metric to be shocking. If I had used IRR to calculate returns in a finance exam, I would have gotten a failing grade. See here for a short discussion of why IRR is a poor choice for measuring returns. The key sentence from this McKinsey article: “…. typical IRR calculations build in reinvestment assumptions that make bad projects look better and good ones look great.”

More sophisticated analysts and investors call for the use instead of “public market equivalent” as the measure of private equity returns, which compares the returns of private equity funds to what would have been realized had the fund invested in the reference investment instead. And notice that the widespread use of the S&P 500 as a benchmark is also flattering to private equity. Private equity invests in vastly smaller companies than those in the S&P 500, and a smaller-stock index would generally show higher returns.

But making a rigorous return calculation using public market equivalent requires that the fund be liquidated, which is typically ten years after its commitment date. Otherwise, analysts have to rely on the private equity fund’s self-assigned “net asset value” for the investments that have yet to be sold. Academic studies have found that those valuations are goosed at around the time when private equity firms are raising new funds and the air is taken out of the marks over time. But the requirement that rigor means looking only at fully liquidated funds also means that the best studies have yet to pick up post crisis underperformance in the boom of private equity fundraisings in the runup to the crisis.

Finally, the private equity has gotten tremendous mileage out of currying investor belief that they can beat the odds and invest in top quartile funds. We debunked that myth in an older post. But bizarrely, the fantasy that investors can find those funds continues even after two separate studies determined that persistence of outperformance of top quartile funds ended in the late 1990s.

We’ve also had private equity industry defenders in comments try to claim that private equity delivers consistent high performance “year after year”. That too is inaccurate. Private equity is highly cyclical. And remember, when looking at these charts, that institutional investors in private equity generally make commitments year after year. They don’t try to market-time, although they will reduce or increase their allocation to various strategies, including private equity, periodically.

Appelbaum and Batt discuss the not-widely-acknowledged cyclicality of private equity in their CEPR paper:
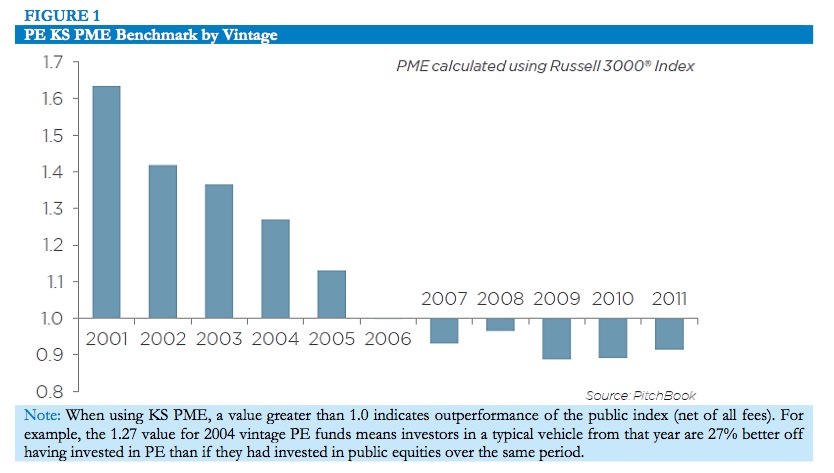
The public market equivalent (PME) benchmark developed by Steven Kaplan and Antoinette Schoar makes it possible to directly compare private equity fund performance to the performance of a stock market index such as the Russell 3000 that consists of publicly traded companies of the same size as most companies acquired by PE funds. Figure 1 below, from the 2014 Q2 PitchBook benchmarking and fund performance report, shows how the performance of the typical PE fund from the date of its inception compares with that of the stock market over the same period.

Figure 1 shows quite dramatically both that PE returns are highly cyclical and that they have fallen steadily since the 2001 vintage year. Funds launched in the years immediately following the dot-com bust, when the stock market was in the doldrums and enterprise values for publicly traded and family-owned businesses were low, typically outperformed the stock market by a wide margin in subsequent years – enough to make investing in private equity worthwhile. The 1.27 value of the PME for the typical fund launched in 2004, while below the value in earlier years, indicates an outperformance of 27 percent since the fund’s inception 9 years earlier, or an annual outperformance of just under 2.7 percent. The typical fund launched a year later, in 2005, beat the s tock market by just 10 percent since inception, or by 1.2 percent a year over the subsequent 8 years. Funds launched in any year after 2005 have done much worse and have typically failed to beat the stock market.


It is important to understand that this issue is also more important than it seems. An investment strategy does not legitimately rise to the prized status of being an asset class unless its returns do not correlate much with that of established asset classes like stocks and bonds. The discussion above clearly shows that private equity returns are influenced by public market returns.

Yet limited partners have chosen to buy the general partners’ propaganda that private equity returns don’t covary much with the stock market. If you believed that palaver, you’d see value in investing in private equity merely for portfolio diversification, and not for performance alone.

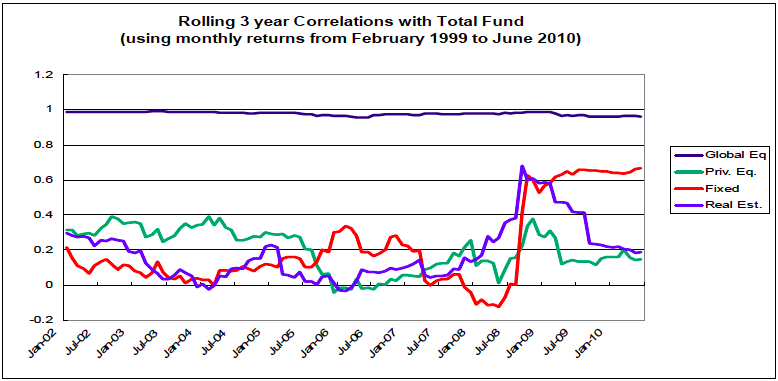
So another proof of the degree of limited partners’ intellectual capture is that they not only accept the use of IRR which exaggerate private equity returns but also believe preposterous claims by the general partners that there is little correlation between public versus private equity values. For example, the chart below shows the historic correlation supposedly experienced by CalPERS of its private equity portfolio and its global public equity portfolio compared to its total fund performance.


This graph shows that “Global Equity” (publicly-traded stocks) has a correlation to CalPERS total fund performance of almost one, meaning that variation in stock prices accounts for almost all of the variability in CalPERS’ fund performance. By contrast, private equity’s correlation has hovered around 0.2 and has been close to zero for meaningful periods, suggesting that the general partners mark their assets with little, and sometimes no, regard for comparable public market comparable company valuations.

This very low correlation is simply not plausible in the real world. Whether an asset is privately or publicly owned should have little, if any, effect on its value. But make no mistake, many limited partner investors in private equity view what is generously called “smoothing” of valuation volatility (aka, “fibbing”) by the general partners to be a feature, not a bug, of private equity investing, since it allows the limited partners’ portfolios to appear less volatile than they otherwise would (though CalPERS is clearly skeptical of this low correlation claim, since it assigns a going-forward correlation between public and private equity of 0.75).

Now as indicated, some of the investors widely seen as sophisticated look to be less enamored with private equity than in the past. You may recall the comment above from Harvard’s CIO that private equity isn’t meeting their risk-return requirements; in late May, CalPERS was reported to have cut its allocation to private equity for the second time in three months. More sober-minded assessments are long overdue, and we can only hope that the combination of private equity grifting exposed by the SEC and the diminished enthusiasm shown by industry leaders will induce other limited partners to reassess their level of commitment. 

June 3, 2014

The Velocity Of Money In The U.S. Falls To An All-Time Record Low

When an economy is healthy, there is lots of buying and selling and money tends to move around quite rapidly.  Unfortunately, the U.S. economy is the exact opposite of that right now.  In fact, as I will document below, the velocity of M2 has fallen to an all-time record low.  This is a very powerful indicator that we have entered a deflationary era, and the Federal Reserve has been attempting to combat this by absolutely flooding the financial system with more money.  This has created some absolutely massive financial bubbles, but it has not fixed what is fundamentally wrong with our economy.  On a very basic level, the amount of economic activity that we are witnessing is not anywhere near where it should be and the flow of money through our economy is very stagnant.  They can try to mask our problems with happy talk for as long as they want, but in the end it will be clearly evident that none of the long-term trends that are destroying our economy have been addressed.

Discussions about the money supply can get very complicated, and that can cause people to tune out, but it doesn't have to be that way.

To put it very basically, when there is lots of economic activity, there is lots of money changing hands.

When there is not very much economic activity, the pace at which money circulates through our system slows down.

That is why what is happening in the U.S. right now is so troubling.

First, let's look at M1, which is a fairly narrow definition of the money supply.  The following is how Investopedia defines M1...
A measure of the money supply that includes all physical money, such as coins and currency, as well as demand deposits, checking accounts and Negotiable Order of Withdrawal (NOW) accounts. M1 measures the most liquid components of the money supply, as it contains cash and assets that can quickly be converted to currency. It does not contain "near money" or "near, near money" as M2 and M3 do.
As you can see from the chart posted below, the velocity of M1 normally declines during a recession.  Just look at the shaded areas in the chart.  But a funny thing has happened since the end of the last recession.  The velocity of M1 has just kept falling and it is now at a nearly 20 year low...

Velocity Of Money M1

Next, let's take a look at M2.  It includes more things in the money supply.  The following is how Investopedia defines M2...
A measure of money supply that includes cash and checking deposits (M1) as well as near money. “Near money" in M2 includes savings deposits, money market mutual funds and other time deposits, which are less liquid and not as suitable as exchange mediums but can be quickly converted into cash or checking deposits.
In the chart posted below, we can once again see that the velocity of M2 normally slows down during a recession.  And we can also see that the velocity of M2 has continued to slow down in the "post-recession era" and has now dropped to the lowest level ever recorded...

Velocity Of Money M2

This is a highly deflationary chart.

It clearly indicates that economic activity in the U.S. has been steadily slowing down.

And if we are honest, we have to admit that we are seeing signs of this all around us.  Major retailers are closing down stores at the fastest pace since the collapse of Lehman Brothers, consumer confidence is down, trading revenues at the big Wall Street banks are way down, and the steady decline in home sales is more than just a little bit alarming.

In addition, the employment situation in this country is much less promising than we have been led to believe.  According to a report put out by the Republicans on the Senate Budget Committee, an all-time record one out of every eight men in their prime working years are not in the labor force...
"There are currently 61.1 million American men in their prime working years, age 25–54. A staggering 1 in 8 such men are not in the labor force at all, meaning they are neither working nor looking for work. This is an all-time high dating back to when records were first kept in 1955. An additional 2.9 million men are in the labor force but not employed (i.e., they would work if they could find a job). A total of 10.2 million individuals in this cohort, therefore, are not holding jobs in the U.S. economy today. There are also nearly 3 million more men in this age group not working today than there were before the recession began."
Never before has such a high percentage of men in their prime years been so idle.
But since they are not counted as part of "the labor force", the government bureaucrats can keep the "unemployment rate" looking nice and pretty.

Of course if we were actually using honest numbers, the unemployment rate would be in the double digits, our economy would be considered to have been in a recession since about 2005, and everyone would be crying out for an end to "the depression".

And now we are rapidly approaching another downturn.  In my recent articles entitled "Has The Next Recession Already Begun For America’s Middle Class?" and "27 Huge Red Flags For The U.S. Economy", I detailed much of the evidence for why this is true.

And those that run the Federal Reserve know all of this.

That is one of the reasons for all of the "quantitative easing" that they have been doing.  The folks at the Fed know that the U.S. economy would probably drift into a deflationary depression if they just sat back and did nothing.  So they flooded the system with money in a desperate attempt to revive economic activity.  But instead, most of the new money just ended up in the pockets of the very wealthy and further increased the divide between those at the top and those at the bottom in this country.

And now Fed officials are slowly scaling back quantitative easing because they apparently believe that the economy is getting "back to normal".

We shall see.

Many are not quite so optimistic.

For example, the chief market analyst at the Lindsey Group, Peter Boockvar, believes that the S&P 500 could plummet 15 to 20 percent when quantitative easing finally ends.

Others believe that it will be much worse than that.

Since 2008, the size of the Fed balance sheet has grown from less than a trillion dollars to more than four trillion dollars.  This unprecedented intervention was able to successfully delay the coming deflationary depression, but it has also made our long-term problems far worse.

So when the inevitable crash does arrive, it will be much, much worse than it could have been.
Sadly, most Americans do not understand these things.  Most Americans simply trust that our "leaders" know what they are doing.  And so in the end, most Americans will be completely blindsided by what is coming.

Coasting Towards Zero

In just about any realm of activity this nation does not know how to act. We don’t know what to do about our mounting crises of economy. We don’t know what to do about our relations with other nations in a strained global economy. We don’t know what to do about our own culture and its traditions, the useful and the outworn. We surely don’t know what to do about relations between men and women. And we’re baffled to the point of paralysis about our relations with the planetary ecosystem.

To allay these vexations, we just coast along on the momentum generated by the engines in place — the turbo-industrial flow of products to customers without the means to buy things; the gigantic infrastructures of transport subject to remorseless decay; the dishonest operations of central banks undermining all the world’s pricing and cost structures; the political ideologies based on fallacies such as growth without limits; the cultural transgressions of thought-policing and institutional ass-covering.

This is a society in deep danger that doesn’t want to know it. The nostrum of an expanding GDP is just statistical legerdemain performed to satisfy stupid news editors, gull loose money into reckless positions, and bamboozle the voters. If we knew how to act we would bend every effort to prepare for the end of mass motoring, but instead we indulge in fairy tales about the “shale oil miracle” because it offers the comforting false promise that we can drive to WalMart forever (in self-driving cars!). Has it occurred to anyone that we no longer have the capital to repair the vast network of roads, streets, highways, and bridges that all these cars are supposed to run on? Or that the capital will not be there for the installment loans Americans are accustomed to buy their cars with?

The global economy is withering quickly because it was just a manifestation of late-stage cheap oil. Now we’re in early-stage of expensive oil and a lot of things that seemed to work wonderfully well before, don’t work so well now. The conveyer belt of cheap manufactured goods from China to the WalMarts and Target stores doesn’t work so well when the American customers lose their incomes, and have to spend their government stipends on gasoline because they were born into a world where driving everywhere for everything is mandatory, and because central bank meddling adds to the horrendous inflation of food prices.

Now there’s great fanfare over a “manufacturing renaissance” in the United States, based on the idea that the work will be done by robots. What kind of foolish Popular Mechanics porn fantasy is this? If human beings have only a minor administrative role in this set-up, what do two hundred million American adults do for a livelihood? And who exactly are the intended customers of these products? You can be sure that the people of China, Brazil, and Korea will have enough factories of their own, making every product imaginable. Are they going to buy our stuff now? Are they going to completely roboticize their own factories and impoverish millions of their own factory workers?

The lack of thought behind this dynamic is staggering, especially because it doesn’t account for the obvious political consequence — which is to say the potential for uprising, revolution, civic disorder, cruelty, mayhem, and death, along with the kind of experiments in psychopathic governance that the 20th century was a laboratory for. Desperate populations turn to maniacs. You can be sure that scarcity beats a fast path to mass homicide.

What preoccupies the USA now, in June of 2014? According to the current cover story Time Magazine, the triumph of “transgender.” Isn’t it wonderful to celebrate sexual confusion as the latest and greatest achievement of this culture? No wonder the Russians think we’re out of our minds and want to dissociate from the West. I’ve got news for the editors of Time Magazine: the raptures of sexual confusion are not going to carry American civilization forward into the heart of this new century.


In fact, just the opposite. We don’t need confusion of any kind. We need clarity and an appreciation of boundaries in every conceivable sphere of action and thought. We don’t need more crybabies, or excuses, or wishful thinking, or the majestic ass-covering that colors the main stream of our national life.