The name Dick Usher is familiar to regular readers: he was the head of spot foreign exchange for JPMorgan, and the bank's alleged chief FX market manipulator, who was promptly fired after it was revealed that JPM was the bank coordinating the biggest FX rigging scheme in history, as initially revealed in "Another JPMorganite Busted For "Bandits' Club" Market Manipulation." Subsequent revelations - which would have been impossible without the tremendous reporting of Bloomberg's Liam Vaughan - showed that JPM was not alone: as recent legal actions confirmed, virtually every single bank was also a keen FX rigging participant. However, the undisputed ringleader was always America's largest bank, which would make sense: having a virtually unlimited balance sheet, JPM could outlast practically any margin call, and make money while its far smaller peers were closed out of trades... and existence.
But while the past year revealed that FX rigging was a just as pervasive, if not even more profitable industry for banks than the great Libor-fixing scandal (for details see "How To Rig FX Like A Pro "Bandit", And Make Millions In The Process"), the conventional wisdom was that it involved almost exclusively bankers at the largest global banks including JPM, Goldman, Deutsche, Barclays, RBS, HSBC, and UBS.
Now, courtesy of some more brilliant reporting by Vaughan, we can finally link banks with the other two facets of what has emerged to be an unprecedented FX-rigging "triangle" cartel: private sector companies that have no direct banking operations yet who have intimate prop trading exposure, as well as central banks themselves.
By "banks" we, of course, refer to the ringleader itself: JP Morgan, and its former head of spot forex trading in London, Dick Usher. As for the company that benefited from its heretofore secret participation in the biggest FX rigging scandal in history, it is none other than British Petroleum.
We learn about all this thanks to a story that begins with, of all thing, a story about freshwater fishing at a lake in Essex called "Wharf Pool."
As Bloomberg reports, "an hour away by train, in London’s financial district, the lake’s owners ply their trade. Wharf Pool was purchased for about 250,000 pounds ($388,000) in 2012 by Richard Usher, the former JPMorgan Chase & Co. trader at the center of a global investigation into corruption in the foreign-exchange market, and Andrew White, a currency trader at oil company BP Plc. "
The plot thickens: was there more than a passing connection between the head FX trader at JPM and White "who’s known in the market as Tubby, is one of half a dozen spot currency traders working for British Petroleum (BP) in London. He and his colleagues, most of them ex-bankers, decide which firms will carry out their foreign-exchange transactions. That makes them prized clients for banks seeking a slice of the business and a glimpse into potentially market-moving trades. Passing on information was a way to curry favor."
In short, a typical Over The Counter relationship between a banker and a buyside client, one which is largely unregulated and where the bank hopes to be able to frontrun the client's orders by providing the client with confidential market moving information, thus generating more business with the client in the future. In this case, however, the buyside client was not a typical hedge fund, but the FX trading group at one of the world's largest energy companies: a group which trades enormous amounts of FX every single day, both with intent to hedge, and to generate a profit.
The trading unit’s primary role is to manage the firm’s exposure to financial risks, including fluctuations in interest rates and foreign exchange, according to the company’s website. Unlike at most corporations, it also is run as a profit center, which means that in addition to hedging risks, traders can place their own bets on the direction of markets. The company doesn’t break out how much money the treasury unit makes
Basically, BP's energy operations were just a balance sheet funding cover: what its FX traders did in the front office was trade for a profit pure and simple, just like any prop trading desk or hedge fund anywhere else in the world. And it did so in collusion with a small group of market rigging individuals all located at the biggest, market-moving banks around the globe.
A quick reminder on the "Cartel":
The four banks in the Cartel controlled about 45 percent of the global spot-currency market, according to a survey by Euromoney Institutional Investor Plc, so information about their plans was valuable. Some days they worked together to push around the 4 p.m. fix, settlements with the banks show.
The Cartel chat room was started by Usher as early as 2009, according to a person with knowledge of the matter. Usher had risen quickly to the top of his profession. After joining HBOS Plc in 2001, he was hired by Royal Bank of Scotland Group Plc in 2003 and a year later collected an industry award on his employer’s behalf.... The four members of the chat room ribbed each other like high school buddies. Usher was referred to as Feston because he resembled an overweight version of British chef Heston Blumenthal, according to people who have seen the chats. Matt Gardiner, a UBS trader based in Zurich, was called Fossil because he was a few years older than the others. Rohan Ramchandani, Citigroup’s cricket-loving head of spot trading, was called Ruggy, while Chris Ashton, the last one to join, was dubbed Robocop.
Now we can add BP too, a BP which doesn't even hide the prop-trading nature of its FX "hedging" group, which is located two blocks away from, wait for it, JPMorgan!
The two dozen traders in BP’s treasury trading unit are housed above a Porsche showroom on the second and third floors of the company’s office in Canary Wharf, an area of reclaimed docklands three miles east of the City of London, the historic financial district. The building, two blocks from JPMorgan’s, was completed in 2003 on the cusp of an oil boom. Lights in meeting rooms flick from green to white when someone enters, in keeping with the company’s corporate colors.
And while until today the last sentence would be pure conjecture, thanks to Bloomberg's release of exchanges between JPM and BP revealing the extent to which the "cartel" would stoop in order to make money for its members on a daily, risk-free basis, it is not a fact.
From Bloomberg:
Copies of messages sent to BP traders over the course of a year were provided to Bloomberg News by a person with access to the online conversations. The person, who redacted the names of banks sending the messages and dates of conversations, said they came from firms whose senior foreign-exchange traders belonged to a chat room called “The Cartel” that was set up by Usher and included dealers at JPMorgan, Citigroup Inc., Barclays Plc and UBS Group AG.
The information offered an insight into currency moves minutes, sometimes hours before they happened. The messages could drag the U.K.’s biggest energy company into a scandal that has enveloped 11 banks and led to more than 30 traders from London to Singapore losing or being suspended from their jobs. Last month six banks were fined $4.3 billion for passing along information about their clients and working together to rig foreign-exchange markets.
Presenting BP: collusive, insider trading hedge fund extraordinaire. All comparisons and similarities to Enron are purely coincidental.
With revenue of almost $400 billion last year and operations in about 80 countries, BP trades large quantities of currency each day. Traders at the company regularly received valuable information from counterparts at some of the world’s biggest banks -- including tips about forthcoming trades, details of confidential client business and discussions of stop-losses, the trigger points for a flurry of buying or selling -- according to four traders with direct knowledge of the practice.
Of course, in any non-banana republic, whose regulatory and enforcement divisions were not captured by the same megacorp that is in question here, this would have been the basis for a massive lawsuit, one which would ultimately seek to break apart the company's "profitable" FX trading division from its core energy business. But not in this republic: after all, between one of the world's biggest banks and one of the world's biggest corporations, and a corrupt, crony government it should be clear to everyone by now just who calls the shots.
BP of course is quick to note that it did nothing illegal: after all the last thing the company needs is its own Enron-type scandal, where an ancillary business manages to drag down the entire company. Sure enough it has promptly denied everything:
BP said in a statement that it conducted an internal review after regulators began probing currency markets. “BP’s FX desk has relationships as a customer with 26 relationship banks, including JPMorgan, Citibank and Barclays,” the London-based company said. “BP has a robust framework of compliance requirements and internal controls which are constantly reviewed, and maintains an open dialogue with the appropriate regulators.”
The firm, the third-largest publicly traded company in the U.K., hasn’t been investigated by regulators looking into currency manipulation, according to a person with knowledge of the matter. Chris Hamilton, a spokesman for the U.K. Financial Conduct Authority, declined to comment, as did representatives of JPMorgan, Barclays, Citigroup and UBS.
So how does one explain the joint equity interest in - for example - the little fishing lake ?
“BP’s Code of Conduct includes mandatory requirements for employees to disclose potential conflicts of interests internally,” the company said in response to a question about the commercial relationship between Usher and White through the fishing lake. “Following such disclosure, steps are taken to manage and monitor these appropriately. It is our policy not to comment on individuals.”
In other words, one can't. Which is how BP likes it. Which is also why Bloomberg was quite cautious with how it phrases BP's involvement into something that could promptly turn out to be Britain's own Enron:
While there’s no evidence that any BP traders were members of the Cartel, Usher participated in at least one chat room with White, according to a person who has examined conversations that included both men. It couldn’t be determined from the messages reviewed by Bloomberg News who sent the information to BP or whether BP employees acted on any of the tips.
They did, and this is how we know: "Traders at BP haven’t been accused of any wrongdoing. Last year, within hours of regulators announcing probes, the chats between BP and the banks were shut down, people with knowledge of the matter said. Soon after, a compliance officer was placed on the desk for the first time, one of them said."
Not exactly something one would do if one was, for lack of a better term, innocent.
And while we hold our breath until UK's justice (don't laugh please) system assigns blame - by which we mean a $19.95 one time settlement with a promise by BP it will never do it again - here is a glimpse at the full extent of just how this rigging took place:
In the clubby, lightly regulated world of foreign exchange, traders passed around tips to their circle of trusted contacts like candy. The victims: mutual-fund investors, pensioners and day traders who took the other side of a transaction at a lower price than they would have if they had the same information....
In an undated message seen by Bloomberg News, a trader at a bank told BP he would be buying U.S. dollars against Australian dollars at the WM/Reuters fix at 4 p.m. in London, the one-minute window during which traders around the world exchange billions of dollars of currency on behalf of pension funds and asset managers. The message was received at BP about 30 minutes before the fix. By tipping his hand, the sender was telling BP about a potential fall in the Australian currency
At about 3 p.m. in London on a different afternoon, BP traders were informed that banks were selling dollars against the yen at 4 p.m. In a third message, this one arriving as the oil company’s traders drank their first coffee of the morning, a trader at a bank said he had just sold a quantity of an emerging-market currency, to whom and the price he received.
The settlements the banks reached with regulators reveal that in the minutes before 4 p.m. the traders would meet on chat rooms to discuss their positions and how they planned to execute them. Sometimes they also agreed to work together to push exchange rates around to boost their profits –- something they called “double-teaming.”
All of the above would be, if proven, criminal but in line with expectations: after all when given a carte blanche to do anything they want, humans will do just that, even if it means trample every regulation known to man. In fact, the bigger one's balance sheet, the greater one's percevied (and realized) leeway of sneaking between the legal cracks, facilitated by the number of politicians and regulators that have been coopted and outright purchased courtesy of said big balance sheet.
However, the true punchline is this: "[Usher] joined JPMorgan as head of spot foreign exchange in 2010, where he became a member of the now-defunct Bank of England’s Chief Dealers Sub Group, a collection of about a dozen currency traders and central bank officials who met at restaurants and bank offices to discuss industry developments."
In other words, all of this rigging, all of the FX manipulation, all of the criminal abuse of naive, innocent market participants took place with the Bank of England's own seal of approval. Which, of course, is why the BofE itself had to scapegoat its own sacrificial lamb to avoid any further connection to this criminal cartel - something it did in early November when it fired its Chief FX dealer, Martin Mallett, who on November 12 "was dismissed by the Bank of England yesterday for “serious misconduct relating to failure to adhere to the Bank’s internal policies,” according to a statement by the central bank today."
And just like that all loose ends have been cut off, although if we were Mr. Mallett, we would certainly keep away from loose nail guns, hot tubs or airplanes for the next several months.
In the meantime, after the mandatory pause of 3-6 months, all rigging, all manipulation, and all criminal abuse with blessing from the central bank itself will quietly return, because until the great (and as increasingly more predict, very violent) reset finally comes, nothing can possibly change in a system as corrupt as this one.
Source
Since about 2001, several sectors of the economy have become increasingly inefficient, in the sense that it takes more resources to produce a given output, such as 1000 barrels of oil. I believe that this growing inefficiency explains both slowing world economic growth and the sharp recent drop in prices of many commodities, including oil.
The mechanism at work is what I would call the crowding out effect. As more resources are required for the increasingly inefficient sectors of the economy, fewer resources are available to the rest of the economy. As a result, wages stagnate or decline. Central banks find it necessary lower interest rates, to keep the economy going.
Unfortunately, with stagnant or lower wages, consumers find that goods from the increasingly inefficiently sectors are increasingly unaffordable, especially if prices rise to cover the resource requirements of these inefficient sectors. For most periods in the past, commodities prices have stayed close to the cost of production (at least for the “marginal producer”). What we seem to be seeing recently is a drop in price to what consumers can afford for some of these increasingly unaffordable sectors. Unless this situation can be turned around quickly, the whole system risks collapse.
Increasingly Inefficient Sectors of the Economy
We can think of several increasingly inefficient sectors of the economy:
Oil. The problem with oil is that much of the easy (and thus, cheap) to extract oil is gone. There seems to be a great deal of expensive-to-extract oil available. Some of it is deep under the sea, even under salt layers. Some of it is very heavy and needs to be “steamed” out. Some of it requires “fracking.” The extra extraction steps require the use of more human labor and more physical resources (oil and gas, metal pipes, fresh water), but output rises by very little. Liquid extenders to oil, such as biofuels and coal-to-liquid operations, also tend to be heavy resource users, further exacerbating the problem of the rising cost of production for liquid fuels.
I have described the problem behind rising costs as increasing inefficiency of production. The technical name for our problem is diminishing returns. This situation occurs when increased investment offers ever-smaller returns. Diminishing returns tends to occur to some extent whenever resources of any kind are extracted from the ground. If the extent of diminishing returns is small enough, total costs can be kept flat with technological advances. Our problem now is that diminishing returns have grown to such an extent that technological advances are no longer keeping pace. As a result, the cost of producing many types of goods and services is growing faster than wages.
Fresh Water. This is another increasingly inefficient sector of the economy, in terms of the amount of fresh water that can be produced with a given amount of resource investment. In some places deeper wells are needed; in others, desalination plants. Water from deeper wells may need additional treatment to remove the harmful minerals and radiation found in water from deeper wells.
As a result of the extra investment required, the price of fresh water is rising in many parts of the world. The higher cost is often justified as necessary to encourage conservation of a scarce resource. But from the point of view of the buyer, what is happening is an increasing price for the same product, or diminishing returns.
Grid Electricity. The price of grid electricity has been rising faster than inflation in many parts of the world for a variety of reasons. If nuclear plants are planned, they are being made in ways that are hopefully safer, but are more expensive. Adding solar PV and offshore wind is expensive, especially when grid changes to accommodate them are considered as well. Functioning plants of various kinds (coal, nuclear) are being replaced with other generation because of pollution problems (CO2) or feared pollution problems (radiation). The cost of producing electricity then rises because the cost of electricity from a fully depreciated plant of any kind is extremely low. Building any kind of new facility, no matter how theoretically efficient over, say, the next 40 years, requires physical resources and people’s time, in the current time period.
As these changes are made, the amount of grid electricity output does not rise very much compared to the resources and human labor required in the current period. The user experiences a higher cost for the same product. From the perspective of the user’s pocketbook, the result looks like diminishing returns.
Metals and Other Minerals. In the same manner as oil, we extract the easiest (and cheapest) to extract minerals first. These minerals include metals and other substances such as uranium, lithium, and rare earth minerals. Part of the problem is that ores of lower concentration must be used, leading to a need to move larger amounts of extraneous material that later must be disposed of. These ores may be found deeper in the ground or in more remote locations, adding to extraction costs. Furthermore, oil is generally used in the extraction of these minerals. As the cost of oil cost rises, this adds to the cost of mineral extraction, making minerals increasingly unaffordable.
Advanced Education of Would-Be Workers. If 20% of the work force needs college educations, it makes sense to provide 20% of young people workers with college educations. If the percentage of workers requiring college educations rises to 30%, it makes sense to provide 30% of young people with college educations. Small percentages of more advanced degree recipients are needed as well.
Instead of following a common sense approach of educating only the number of workers who need a given amount of education with that amount of education, in the United States we have gotten onto a treadmill of encouraging increasing numbers of young people to pursue bachelors, masters, and Ph.D. degrees. To make matters worse, universities have established requirements that faculty do more research and less teaching, whether or not research in a particular field can be expected to benefit the economy to any significant extent. To accommodate this research-intensive approach, a layer of deans is added to work on obtaining funding for research. In addition, students are often provided more comfortable dorms with private rooms and private baths, adding costs to obtaining advanced education but not really enhancing future job prospects.
All of this produces an incredibly expensive higher education system, with costs way out of proportion to the increased wages a student can expect to earn from attending the university. Students are expected to pay for much of the cost of this system through debt to be paid back after graduation (or after dropping out). In some ways, the system might be viewed as an extremely expensive system of sorting out would-be job applicants, with widget makers with a college degree or master’s degree viewed more favorably than ones without, even if there is little use for an advanced degree in that particular job.
US Medical System. The US Medical system is particularly affected by the trend toward more advanced degrees. This approach results in a system where patients need to visit a variety of specialists to handle fairly common ailments, such as a broken arm or dementia in old age. To compensate for the high cost of their advanced education, specialists charge high fees. Hospitals have a large number of testing instruments at their disposal and use them whenever there is even slight justification.
Health outcomes in the US are remarkably bad compared to other developed countries, based on a study by the US Institute of Medicine called U.S. Health in International Perspective: Shorter Lives, Poorer Health.
Read the entire article
Google is a case study of why we need antitrust enforcement. With Google at 97% market share in search [correction: 67%], Yahoo and Bing don’t have enough of a foothold for it to be worth the gamble of trying to beat Google at search, even with Google having degraded its service so badly that there are now obvious ways that a challenger could best them.
I had assumed that the ongoing crapification of Google was for a commercial purpose, namely to optimize the browser for shopping and the hell with everything else. But as we will discuss in more detail below, my experience in poking around to see about buying a new laptop demonstrates that Google has gotten worse at that too. Lambert, who I enlisted to confirm my experience, was appalled and said, “What have they been doing with all that money?” But as we’ll see, there is an evil purpose here, just not the evil purpose we’d first assumed.
It isn’t as if the degradation of Google is a new phenomenon. I used Google heavily while researching ECONNED, which was written on an insanely tight time schedule. It worked really well then. But even a mere year later, by late 2010, the search algo had been restructured in some mysterious way to make the results much less targeted, and it’s been downhill since then. The most recent appalling change came in the last few months: eliminating the ability to do date range searches.
But all of this ruination was so Google could make more money by optimizing for shopping right? Apparently not. I’ve idly and actively looked for stuff on the Internet over the years. A reliable way to do that was to type in a rough or better yet precise description of the product/product name plus the word “price”. That would usually get you a nice list of vendors selling what you wanted so you could comparison shop, and often you’d get links to sites like Nextag which would provide a list of vendors with all-in prices as well as vendro ratings.
Over the last two months, I’ve been looking for an easy-to-install monochrome laser printer (I have NO time to deal with anything more demanding than plug and play, and sadly, dealing with printers on a Mac is not plug and play). I didn’t get any good answers from all my searching and would up buying a used version of my current out-of-production printer. In retrospect, it appears some of my search hassles may have been due to Google, not to having atypical requirements.
To the case study: I am thinking of buying a new Macbook Air and January is when prices are supposed to be the best for computers.* My current one is over four years old and seems to be functioning just fine, but one of my buddies says her employer never would have let me keep a machine that long. And I am only a one-computer household these days, so if my machine died, I’d have to run to the Apple Store and make an emergency purchase (which is one of the advantages of living in Manhattan) But even though I keep a backup on a hard disk on Time Machine, I recently deleted an important file and had to pull a backup off Time Machine. Perhaps I wasn’t doing it right, but the file on the backup disk was months behind the current version, which makes me a bit nervous.**
I want a Macbook Air with a 13 inch screen (I attach an external monitor at home, but on the road, as now, I can get by with just the existing real estate) and 8GB of RAM. All I need is the newest version and the most RAM I can get, since you can’t upgrade the RAM in these solid-state Macs. Note that the 8GB is not the standard configuration, but some stores carry it in stock.
So what happens when I search? Lambert and I used slightly different search strategies, but w got similar results (and yes, I used “8GB” rather than “8 gb”). Here are his results:
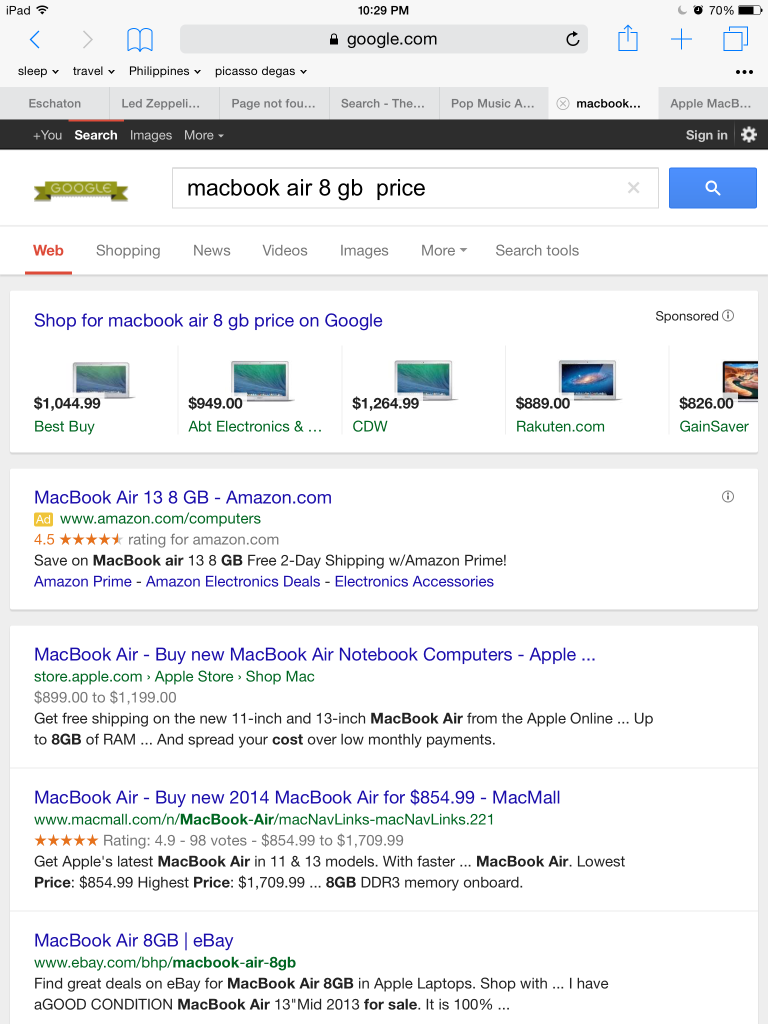
Why is this so terrible? First, none of the five sponsored links takes you to an 8GB Macbook Air. The Amazon link doesn’t either. The Apple one takes you to a landing page for Macbook Airs (the Apple site is an abortion, too much making you read the sales hype and too many clicks to actually make a purchase if you are so inclined). The Macmall link is the only good link on the mess of links. It takes you to a page of MacBook Airs with enough specs listed with each that you can see what one with 8GB of RAM costs. The eBay link was close to useless, in that I’m not interested in a used machine (if I were, I would have gone to eBay directly and yes, the overwhelming majority are used). But even worse, if you click through, it is again not limited to 8GB machines and the results are almost entirely off spec.
But you can see how this defeats comparison shopping, which is one of the alleged big bennies of the Web, if you have to click through a whole bunch of irrelevant links to get to a quote or two. And my version was in some ways worse than Lambert’s. I played with some variants (as in putting terms in quotes, including the screen size). The patterns were that I’d either get a first page with looked like product listings, with at most two of ten links, and none of the sponsored links taking me to what I was looking for. The other results would be heavy on reviews when I was not looking for reviews (and I would not typically get reviews on a “price” search).
So what is going on here? It becomes clearer when you search for something simpler. Apple just launched a swanky new iMac called the Retina iMac for its “retina” screen. Look at these search results:
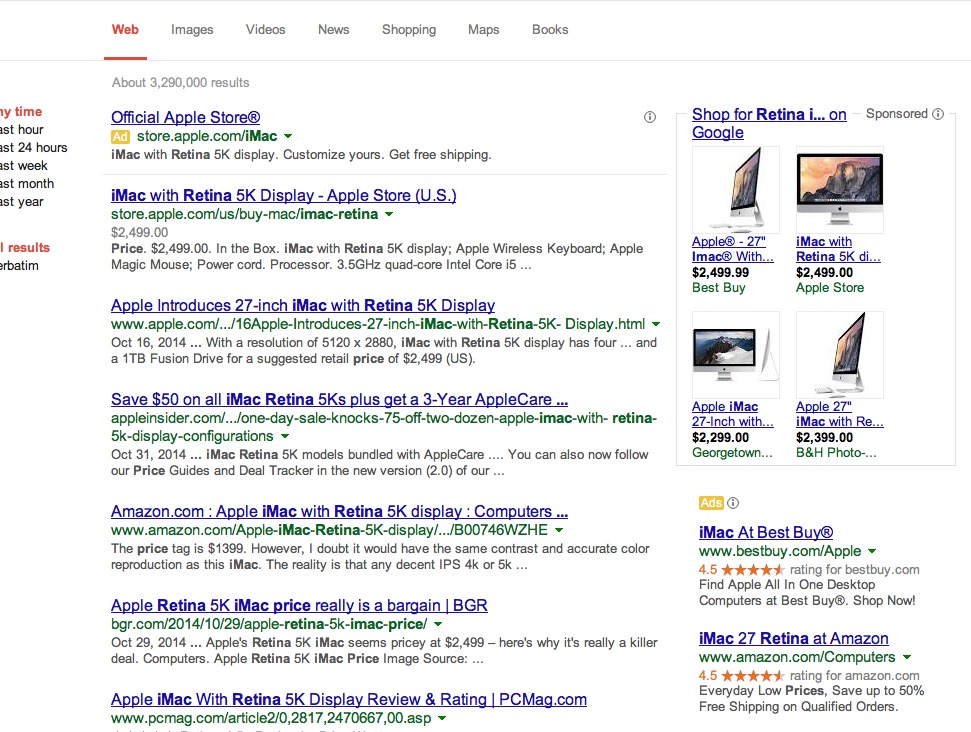
Now we do have Apple as the first Google-like search result and sponsored link as before but in this case, you go straight to a landing page with what you want to see. But the Apple links being better in this case has everything to do with Apple quirks, so we’ll put that aside.
Of the rest of the first page standard search listings, the ONLY other one that takes you to a page where you can buy the product is the Amazon listing, #4 on the page. All the rest are product reviews.
What can we infer? Unless you are Amazon or the manufacturer, if you are a retailer and want to show up on the first page of a Google search, you have to pay for an ad. Otherwise. Google appears to be making sure you won’t get there for free.
Yet Google isn’t making much if any effort to make sure those sponsored ads are all that relevant to you as shopper. Now if it is a unique product, like the Retina iMac, the sponsored ads are more likely to be a match with the search target. But even so, several are links to irrelevant models, such as the BestBuy, WalMart, and Stuccu ads.
So Google is indeed being optimized…..for its own advertising. The message to all but the very biggest vendors is that you must pay to show up. No more getting in the back door by being picked up by an price listing service that gets on Google’s first page, or by matching the search terms well.
But as a user, it looks like Google is cooking its own goose. These crappy results makes me much more inclined to go to Amazon and look at Amazon merchants, and compare price at 3 or 4 Apple vendors I know are reliable with returns in case I get a bum machine. The fact that I’m not getting remotely usable results from Google searches and that means I’ll skip them.
How long will it take for advertisers to realize that they are effectively being scammed by Google, that they are often paying for bad clickthroughs because Google is putting them on search results where they don’t belong but the retailer has written successful clickbait ads so they get bad visits? My impression is that Google Adsense reporting is opaque enough that they might not recognized Google’s culpability (indeed, I can see Google optimizing its algos to keep the bad clickthroughs at the highest level that an advertiser would tolerate).
And in the meantime, all we have as customers to look forward to is the Godzilla versus Mothra battle of Amazon versus Google in shopping search. It’s enough to make one think nostalgically about malls. And I was never a fan of them either.
Update: Some readers say that they can access date range searches through “Search Tools. One provided a link as to how it displays. It sits on the far right of the list of options that starts with “Web Images Videos” etc.
I do not have Search Tools appear, as you can see below. So my statement is accurate. I cannot access date range searches:

_____
* Just so you know, I hate buying new computers. I hate all the time the setup takes, I hate that some things never work the same, I hate having to find and download drivers. My pattern is to use machines until they die or become so hopelessly memory constrained that I am forced to abandon them. I used my NeXT for 10 and a half years and my TiBook for over eight. The idea of giving up a working machine after four years and a few months offends the Yankee in me, aside from the large tax on my time of getting a new machine broken in.
** Time Machine does dutifully chug with great frequency and slows down my machine in the process, so it appears to be doing something. I’m just not convinced that it is the right something.
Source
As Charles Dickens himself admits, Ebenezer Scrooge is a thoroughly peaceful man, guilty of no true crime, who has robbed no one. Therefore, we must conclude that his wealth is a sign of his ability to please at least some people, and as Michael Levin notes: “Dickens doesn't mention Scrooge's satisfied customers, but there must have been plenty of them for Scrooge to have gotten so rich.”
But as he is a person with bad manners and a disagreeable personality, many have conflated Scrooge’s personality traits with his business practices, although the two are unrelated phenomena. As a miser and businessman, Scrooge provides numerous valuable services to the community including, as Walter Block has shown, driving down prices and making liquidity available to those who, unlike the wrongly maligned misers, have been either unwilling or unable to save in comparable amounts.
His business prowess notwithstanding, however, a closer look at Scrooge’s economics suggests some significant blind spots in several areas. Scrooge, as displayed in many of his comments and observations, misunderstands some key economics concepts. Indeed, Scrooge’s ignorance in these areas may contribute to his bad habit of assuming that others are taking advantage of him, or are too foolish or lazy to attain what Scrooge has.
Value is Subjective
As Carl Menger demonstrated long ago, value is subjective and different persons value goods differently depending on the person’s goals in life. Does the person want to raise a family? Perhaps he wishes to be an independent scholar who devotes all his time to reading and research. Perhaps he wishes to be a hermit who prays most of the day. Money prices reflect these goals, and a hermit will value a video game console differently from a gamer. But of course not everything can be calculated in terms of money prices. A like or dislike of Christmas, for example, cannot be calculated this way.
Scrooge, who is apparently not a Christmas enthusiast, greatly values money, and likes to have plenty of it handy. But why? If we accept the analysis of Scrooge’s former fiancée, (a fairly reliable source on that period in his life) she suggests that Scrooge “fear[s] the world too much” and that all his other hopes “have merged into the hope of being beyond the chance of its sordid reproach.”
So here we see the real root of Scrooge’s fondness of money. In Human Action, Ludwig von Mises explained that human action stems from a desire to “remove unease” about one’s present situation. With Scrooge we see (if his fiancée is to be believed) that the thought of being destitute is a source of constant unease for him. Thus, he desires to build as much wealth as possible in the hope of being beyond the possibility of poverty.
As Scrooge’s primary goals is poverty avoidance, this colors how he views all economic action. His peers tend to not recognize this in him, either dismissing his as simply “odious,” as Mrs. Cratchit does, or as unhappy.
In fact, as Levin demonstrates, Scrooge appears rather content with his situation at this point, although, unfortunately — just as Scrooge’s colleagues and family members do not appreciate his ranking of values — Scrooge does not seem to appreciate that others might value money for different reasons.
This is demonstrated in an early exchange with Scrooge’s nephew. When wished a merry Christmas by his nephew Fred, Scrooge retorts "What right have you to be merry? What reason have you to be merry? You're poor enough."
To this Fred replies, "What right have you to be dismal? What reason have you to be morose? You're rich enough."
Fred is probably wrong about Scrooge being morose, and he also appears to not understand why Scrooge values money.
But at the same time, Scrooge also displays an ignorance of value subjectivity by suggesting that Fred’s ability to be merry is rendered impossible by his poverty.
(Now, in this case, “poverty” as used by Scrooge is a highly relative term. We know from the text that Fred enjoys a comfortable middle-class lifestyle in which he can afford a servant girl, plenty of lamplight, and a Christmas feast for his many friends. Moreover, Fred’s wife is, according to Scrooge’s own assessment, “exceedingly pretty.”)
In this same exchange, although Fred doesn’t understand how Scrooge could be happy, it is Fred who displays a better understanding of economic value when, in response to Scrooge’s declaration of Fred’s poverty, Fred declares “There are many things from which I might have derived good by which I have not profited.” By this, Fred means that he profits from many things which bring him no money profits.
Is Scrooge More Prudent?
It is often supposed by both critics and defenders of Scrooge (and by Scrooge himself) that he is a more skilled businessman than most, and that he is more savvy, more intelligent, and more prudent in his management of his own affairs. Other people, Scrooge supposes, are more likely to be incautious and trust to fate for good fortune.
But there is ample evidence that the lack of material wealth enjoyed by others is not due to any lack of intelligence or prudence, but simply that they value things differently from Scrooge.
Scrooge’s ex-fiancée, for example, is no fool when it comes to money. In her final conversation with Scrooge, she notes that when she and Scrooge had agreed to marry, it was assumed that they would be poor in the beginning, but that “we could improve our worldly fortune by our patient industry.” In this, she is expressing what most young heads of household know — that in most circumstances, households build wealth slowly, since raising a family is costly. Her words hardly suggest a woman who plans to throw caution to the wind.
There is no denying that Scrooge is highly skilled at attaining what he values, (i.e., large amounts of material wealth in the form of cash and revenue-producing capital) but it does not follow that others do not possess these things because they are less intelligent or less industrious. Others simply value other things in life such as child rearing, Christmas celebrations, and consumption as well as the things that can be obtained by “patient industry.”
Scrooge is quick to assume that others are imprudent for marrying (he is dismayed by his nephew’s decision to marry for love) or doing other activities they find to be pleasurable when those same energies could be devoted to making money. But Scrooge is simply imposing his value systems on others, although in this, he is no more guilty than Dickens, Fred, and all the others who insist that Scrooge absolutely must celebrate Christmas.
Bob Cratchit: Victim or Wily Negotiator?
In addition to lacking insight on the subjective nature of value, Scrooge also fails to understand the intricacies of voluntary exchange.
Much is made by Dickens of how Cratchit is the hapless victim of Scrooge’s miserliness, and in response, the contrarians note that if Cratchit were indeed underpaid, as Dickens implies, then Cratchit is free to find employment elsewhere.
This is no doubt true, all things being equal, but we also find that Scrooge himself, well before his change of heart at the end of the story, is open to re-negotiating the terms of Cratchit’s employment. Scrooge denies his openness to renegotiation in words, but shows it with his actions.
When Cratchit asks for a vacation day on Christmas day, Scrooge claims that this is akin to “picking a man’s pocket,” but ultimately, Cratchit negotiates for himself the day off, with nothing more than a tepid “be here all the earlier next morning,” from Scrooge. Scrooge was not compelled to give Cratchit the day off, so given Scrooge’s clearly demonstrated immunity to social pressures, it stands to reason that Scrooge concluded it was more profitable to give Cratchit the day off than face the possibility of losing Cratchit as his clerk. But even if he were susceptible to being shamed into giving the day off, he is nonetheless voluntarily doing so.
At this point, Scrooge shows that his claim of having his pocket picked is sheer nonsense since we plainly see that his demonstrated preference was to grant the day off. Scrooge cannot now claim that he was somehow robbed. If he felt he was being robbed, he could have denied Cratchit the day off. It turns out, however, that Cratchit, while not “underpaid,” is at least seen as a bargain employee by Scrooge, and so much so that Scrooge felt he could afford to voluntarily pay Cratchit a small raise in the form of a day off.
Poor Scrooge
Ebenezer Scrooge asks very little of his fellow human beings. He only asks that they keep up their ends of the bargains in the business agreements they make. It was just his misfortune, then, that he is surrounded by a bevy of control freaks who are hell bent on making sure Scrooge enjoys Christmas in just the way they want him to.
Scrooge returns the favor by maintaining a ferociously low opinion of most others around him, concluding quite often that others are simply fools for choosing to enjoy the company of friends and family when there’s money to be made.
Ultimately, though, it’s all just an unfortunate misunderstanding, and one that might be improved by a reading of Man, Economy, and State.
Source
For years, we've been warning here at PeakProsperity.com that the economics of the US 'shale revolution' were suspect. Namely, that they've only been made possible by the new era of 'expensive' oil (an average oil price of between $80-$100 per barrel). We've argued that many players in the shale industry simply wouldn't be able to operate profitably at lower prices.
Well, with oil prices now suddenly sub-$60 per barrel, we're about to find out.
Using the traditional corporate income statement, it is difficult to determine if shale drilling companies make money. There are a lot of moving parts, some deliberate obfuscation at some companies, and the massive decline rates make analysis difficult – since so much of reported profitability depends on assumptions made regarding depreciation and depletion.
So, can shale oil be profitable? If so, at what price? And under what conditions?
I try to deconstruct all this here.
Technology
A shale well consists of a vertical shaft that drives down into the earth to get to the right geological layer where the oil is located. Then the shaft bends 90 degrees, and extends horizontally 5000-10000 feet. It is in the horizontal section where the magic takes place. At intervals along the horizontal section, the “frac stages” happen, each of which fracture the surrounding rock to release the oil locked inside the rock.
Constructing a shale well happens in two stages. First both the vertical and horizontal sections of the well are drilled, and that costs around $4 million taking perhaps 20 days. Then, the well is “completed” - this is where the frac stages are placed. Each frac stage costs around $70k, and there are often 20-30 frac stages per well. The entire completion process costs around $4M. Once completed, the well starts producing oil and gas.
The initial production (IP) of a new well is a critical number for estimating the total amount of oil likely to be produced over the lifetime of the well (“Estimated Ultimate Recovery” = EUR), along with the expected decline rate. While the EUR is a theoretical number and assumes a recovery time of 10-30 years, from a practical standpoint, companies need to recoup the costs of drilling the well within 3 years.
Shale drilling has dramatically improved over the past five years. Horizontal lengths have doubled, upgraded drill rigs result in fewer breakdowns and faster drilling speeds, pad drilling has eliminated the downtime required to move the drill.
Today's wells (vs wells drilled in 2008-2011) have horizontal sections twice as long, with three times more frac stages, with closer frac groupings, and the wells are drilled in about half the time. This results in wells that produce about twice as much, and take half the time to drill. However at the same time, many of the best spots have already been drilled, so the significant improvements in drilling efficiency have only been able to increase per-well production by a modest amount – perhaps 7%.
Regions, Geography, Decline Rates
There are three primary geographical regions where shale oil drilling takes place: Bakken, Eagle Ford, and the Permian Basin. Total production in these three areas: 4.6 mbpd, or 92% of shale-region oil production in the US. Shale regions provide all the growth in US domestic oil production.
Of these three areas, Bakken and Eagle Ford are the most productive oil shale areas, and of these two regions, I've selected the Bakken for a more detailed analysis.
Decline Rates
The decline rate of shale is the defining characteristic of a shale well, and a shale region. Decline rates vary by region. On average, the Eagle Ford region has a 62% decline rate, the Bakken region overall has a 54% rate, and the Permian region (many wells there are not horizontal wells) declines at a 33% rate.
Individual wells decline more rapidly, and most steeply in their first year of production: Bakken wells decline at a 72% rate for the first year, and then more slowly in the following years. Many Permian wells are vertical wells, and so their decline rates are much more gradual, accounting for the slower Permian region decline rate.
If a well's IP (initial production) is 1000 bbl/day, a 72% well decline rate means that one year later, that well will only be producing 280 bbl/day. With the IP=1000, the first year production is 205k bbls, and the EUR (lifetime theoretical) is 650k bbls. Here is a look at changes in the decline rates of the different regions over time. [source: http://www.eia.gov/petroleum/drilling/]
Drilling Rights
In order to acquire the right to drill on a particular patch of land, the drilling company must purchase these rights from the landowner, and/or another drilling company that has already bought the rights. In the most productive areas such as the Bakken shale, rights are expensive, with recent transactions priced around $10k per acre.
After a fair amount of experimentation, drillers have determined they can put from 1-3 wells on one square mile before the wells start interfering with each other. There are 640 acres per square mile, therefore drilling rights are about $6.4M/square mile. This makes land costs to be around $2M-$6M per well.
Before you can drill, you have to get the rights. Typically, you go into debt in order to buy the rights, then you start drilling to recoup your investment and pay the interest costs on all that debt. Maybe you can even sell those rights to someone else for a profit. That's the ponzi aspect of shale: buying land rights with junk bond financing for $2000/acre, and selling those right off to an unsuspecting oil major for $10,000/acre.
Rights only last from 5-10 years. Failure to drill = wasted money.
Shale Economics
To understand the economics of shale, we view company performance through the lens of accounting. A good accountant is a historian, honestly assessing the success or failure of a particular venture. (A bad accountant – at Enron, for example – is a fiction writer).
So first, some accounting terms:
- Revenues: barrels of oil sold x the price of oil. Its pretty simple.
- Capex: capital expenditures. In shale, this is all the costs involved in drilling and completing wells, purchasing equipment, land drilling rights, and other long-lived assets required to run the business.
- Opex: operating expenses. In shale, this includes all the other expenses the business has:
- well operations: insurance, repairs, maintenance, pumping costs, etc
- G&A: general & administrative costs – including paying the CEO
- interest expense: for bonds, bank loans, preferred stock dividends
- transport: getting the oil to market
- royalties: paying the landowner a chunk of your revenues
- production taxes: paying the state a chunk of your revenues
- depreciation/depletion: a fraction of capex – it should be the decline rate of each well multiplied by the cost of the land plus the cost to drill & complete.
- Income = revenues – opex – depreciation
- here is where the funny stuff happens. If you want your company to look profitable, you will tell your accountant to write a work of fiction rather than be a historian. Instead of having her use your actual 72% well decline rate, you will instead tell her to use, say, 10%.
- Key concept: understating depreciation increases reported profits. Why would you do this? Well, if you wanted to sell your shale properties to a greater fool, you probably want to look profitable in the meantime. Or if you wanted to get a bank loan, or sell junk bonds, you probably want to look profitable too. Banks are more clever than junk bond buyers, however; they use ratios that depend on EBITDA, not phony “profits.”
- EBITDA: revenues – opex
- Simply put, this is “earnings before accounting/depletion fraud.”
- This is the number I use to study profitability in the shale world. I can then apply my own depreciation based on decline rates and figure out for myself how the business is really doing.
All right, armed with your new degree in shale accounting, let's look at a simple fictional example. The hypothetical One-Well Shale Company obtains property for $10k/acre, then drills and completes a Bakken shale well costing $9M, with an IP of 500 bbl/day, 1st year production: 102k bbl, decline rate 72%. Further, we assume an eventual 3 wells per square mile, and an oil price of $99/bbl.
The income statement shows that with honest accounting, we are barely profitable just looking at the 3-year P&L statement. The price I selected wasn't an accident – I searched for the break-even price and found it at around $99/bbl.
However, will this well at $99/bbl ever make back its drilling costs? It won't, since in the following years, the “fixed costs” for the company will be a heavier and heavier burden on the well whose production declines every year. Likely, $99/bbl is even too low. We can call it a “best case scenario” - only if we assume One Well Shale sells the well to someone else for $986k (the remaining depreciation) at the end of year 3.
What's more, companies have already spent huge sums accumulating land, on which they've drilled a relatively smaller number of wells, so this “One-Well” shale company is definitely fictional. Take OAS, which has 468 wells in production (45k bbl/day = 98 bbl/well) and 779 square miles of land they've bought for $1.8 billion. That's only 0.6 wells per square mile. However, they've already spent the money for the land, so from a “cash flow basis”, they don't really count the land cost when answering the question: “do I want to drill a well here or not.” At this point, money to buy the land is gone, so from a corporate survival standpoint, all they ask is, “if I drop a well, will it pay me back in 3 years?” And in the current environment, they probably only look at year 1 when making this analysis.
But from an overall economic analysis of shale profitability over the longer term, land cost really is an important factor, so we include it in our accounting. If we were to be hard-nosed, we would probably assume a “wells per sq mile” of 0.6, since that's the “actual debt burden” on the real drillers like OAS.
Now lets drop the oil price to $55/bbl and see what happens to One-Well Shale.
Its a sea of red ink. Clearly this well loses money. It cost $9M to drill, and we get back $2M in EBITDA at the end of year 1, the best year for the well. By the end of year 3, EBITDA is negative. It is definitely not worthwhile to drill this well, not even if we assume the land is free.
This represents the average well in the Bakken. At current prices, the average well loses money, no matter how you slice it. So how will this affect capex budgets in 2015? Here's one data point from OAS, a company for whom 100% of their production comes from the Bakken: they are cutting their capex budget in half, choosing only to drill in their better properties. [Source: an awesome, detailed, fact-filled investor document that Google located for me – one wonders if they meant to release it to the public: http://www.oasispetroleum.com/wp-content/uploads/2014/12/2014-12-OAS-IR-PresentationvFINAL.pdf]
Hedging
Shale producers don't want to expose themselves to bouncing oil prices – they have fixed costs, and so they'd prefer to have fixed revenues too. So they typically engage in oil price hedging to eliminate one big variable from their business plan. One-Well Shale certainly had big problems when oil dropped to $55/bbl; if One-Well had engaged in hedging, it might have been able to ride out the low prices at least for a time.
There are many types of hedges available – our friendly banking establishment stands ready to provide all sorts of financial tools to shale companies to help them out. For a fee, of course. I'll start with the simple ones, and gradually get more complicated.
- Swaps: buyer locks in a fixed price for oil. No upside, complete downside protection – you know exactly what price you'll get, and on what date. Low cost. This is why futures markets exist. Speculators take the risk, and companies get to operate in a more predictable world.
- Puts: complete downside protection, unlimited upside. The higher the floor and the longer the date, the higher the cost. Puts are relatively expensive.
- Collars: complete downside protection, lower cost, limited upside. Buyer writes a call, and buys a put. Upside available up to the call strike price, and the call helps make the put less expensive. As with the standard put, the higher the put's strike price and the farther out the date, the more expensive it is.
- 3-Way Collars: limited downside protection, limited upside, usually free cost. Buyer writes a call and a put, and buys another put. This complicated beast generally ends up being free, but only is good for maybe $10-$15 of coverage. It's probably a banker's delight. It sounds vaguely salacious.
When you look at the company hedge book, which they report in their 10-Q, understanding just what sort of coverage they have is quite important. Swaps provide perfect coverage, while 3-way collars only protect against a fraction of the drop we've just experienced. And its important to match up the number of barrels of coverage to the oil production, to see the percentage of coverage the company has in place. A survey of shale companies shows a range of from 20-60% coverage, at an oil price of about 90.
Looking at our favorite Bakken company OAS, we see their hedge book below, helpfully provided in their investor document. It looks complicated. So we just look for key words: first, what type of hedges? Swaps, puts, & 2-way collars. Great, that's 100% coverage. Second, how much production do they represent? 1H 2015: 32k bbl day, and 2H 2015: 15k bbl/day. Let's assume OAS keeps production steady at 45k bbl/day. That's a 71% coverage for 1H 2015, and a 33% coverage for 2H 2015 at “around” $90/bbl. Looks like they'll be mostly ok for 1H 2015, but for 2H 2015 they will definitely be losing money if oil stays at $55/bbl.

Hedges can be cashed in at any time. A company with a trader as a CEO, or one that needs to raise cash to stay in business today might well decide to “go naked” and take their chances with market oil prices and close out their positions. One company did this just recently. CLR sold their entire hedge book in Q3 2014, raking in a cool $420 million. They did this (from what I can tell) when oil was trading at about $77 – about $20/bbl too early. They left $500 million on the table. Maybe more. And now they're fully exposed to $55 oil. Factoid: $420 million will fund one month of 3Q capex at CLR.
Shale History & Accumulated Debt
One-Well Shale's “honest income statement” shows that 2014 shale technology is economical at $100 oil, assuming “average well production” - an IP of 500 is average in the Bakken.
Of course, shale companies must survive today, with oil at $55/bbl. Let's assume OAS gets serious, and drills only in their really hot areas. Viewed through the One Well Shale P&L statement, if I set the IP=750, and I set the oil price to $87/bbl, cash flow is $9M in the first year and a 3-year ROI of 67%. Through 1H 2015, OAS will be all right if they can just drill their best opportunities, and rely on their hedge book to keep them afloat.
That's not the the same thing as asking if the wells they drill will be “profitable long term” since that $87/bbl price obtained via hedges will only last through 1H 2015. Once the hedges run out, those IP=750 wells will be just barely above break-even (after 3 years!) at $55/bbl. But for the moment, OAS can stay above water.
I'm deliberately avoiding the question of how long-lived the shale resource is. I am just answering the question: what is the break-even oil price for drilling a Bakken shale well. The answer is, with an average well (IP=500) at a company with an average cost structure is long-term break-even at about $99/bbl, best case, assuming 3 wells per square mile and a property cost of $10k/acre.
Bottom line: the average US shale oil well is uneconomical even with hedging in place, since most hedging is around $90/bbl and the break-even is $99/bbl.
The Risk We Now Face
In Part 2: The Destruction That Awaits, we delve into the important question of the longevity of shale oil supply. The projections we can make from the latest data are quite frightening.
As is the massive impact today's oil prices will have on the shale industry should they persist. Simply put, if oil prices stay at $55/bbl, we will eventually lose the vast bulk of US shale oil production, simply because perhaps 3/4 of even Bakken shale is just not economical at that price.
And this prediction assumes the economy continues along as it has for the past several years. Should there be a serious economic contraction and/or a tightening of the credit markets, and the declines hit harder, many fewer shale drillers will be able to find any sort of funding, property sales will be fewer and for lower prices, and a lot more shale drillers will go bankrupt – and recoveries on those bankruptcies will be lower. Knock-on effects will hose the banks providing credit lines, vendors that provided services to companies and were not paid, and pension (and bond) funds that bought the junk bonds that are now worth pennies on the dollar. All of this will simply worsen the carnage to the shale sector.
Click here to access Part 2 of this report (free executive summary; enrollment required for full access)
Source
Christmas may be not so merry as we hope. Economists have argued that gift giving is an inefficient way to allocate resources, and it is widely suggested that Christmas brings a peak in prices and the number of suicides, or even disrupts the business cycle. This column discusses some conventional wisdom about Christmas and shows that economic research in fact runs counter to some of these common beliefs.
The idea that Christmas might incur a welfare loss has been well known to economists since Joel Waldfogel published his research on the deadweight loss associated with the holiday season (Waldfogel 1993). In addition, several articles discuss topics like Christmas pricing, weight gain at Christmas, and the optimal height of Christmas trees. In a recent paper (Birg and Goeddeke 2014), we present findings that contradict some common beliefs about Christmas held by economists (and maybe non-economists too).
Do You Believe That Prices Peak During Christmas Time?
Basic economic theory suggests that before Christmas, demand for Christmas-specific goods such as certain foods or consumer goods increases, causing the demand curve to shift outwards. As long as this is not accompanied by an increase in supply, we should expect to see higher equilibrium prices at Christmas. But empirical research shows the opposite – Warner and Barsky (1995) find falling prices for consumer goods such as action figures, power tools, and food processors. This is in line with the research of Chevalier et al. (2003) and MacDonald (2000) who show reduced prices for groceries. Different reasons for this (maybe at first sight) surprising result have been discussed. Warner and Barsky (1995) argue that due to higher economies of scale in price search during periods of high demand it pays-off for consumers to search more for lower prices before Christmas. The demand elasticity for each retailer is thus higher and this reduces prices. Another reason for lower prices might be a higher incentive for firms to deviate from tacit collusion during periods of high demand (Rotemberg and Saloner 1986). Nevo and Hatzitaskos (2006) estimate brand level demand for groceries, finding more price sensitive demand and changed brand preferences during periods of high demand. Consumers switch to cheaper brands and this reduces average prices.
In some countries a popular belief (or rather fear) is that gas prices increase before long weekends or holidays such as Christmas as the increase in holiday travel increases demand for gasoline.1 Is this true for Christmas time? Again, in contrast to the belief, researchers could not to show a price increase before Christmas in the US, Canada, or Australia.2
In one market where one would not have expected it, a price increase before Christmas has been clearly established. In countries celebrating Christmas, stock prices increase in the days before Christmas.3 This particular price increase might be a surprise, at least for economists believing in Fama’s (1970) ‘Efficient Market Hypothesis’, according to which abnormal returns on predetermined occasions such as Christmas cannot exist, as the knowledge of that this effect exists should be sufficient for all rational investors to exploit this effect, so that it eventually disappears. But Chong et al. (2005) show that the Christmas effect declined in the US stock market over the last three decades of the twentieth century. In the long run, this pre-Christmas stock market effect might disappear.
Do You Believe That the Number of Suicides Peaks Before Christmas?
Another common belief is that holiday joy and cheer amplify loneliness and hopelessness and therefore increase suicide rates. Another reason discussed is that high expectations during the holiday season could only be disappointed and thereby cause suicides.4 In a literature review, Carley (2004) shows that empirical research points again in the opposite direction – fewer people commit suicide at Christmas. However, the number of people committing suicide increases subsequently at New Year.
Nevertheless, there seem to be other reasons why Christmas can be life threatening to all of us. The homicide rate increases in the US.5 In addition, a hospital emergency department visit might be especially dangerous at Christmas time. As Phillips et al. (2010) show for the US, the number of people dying in hospital increases at Christmas and New Year. Similar findings have been established for the UK by Keatinge and Donaldson (2005), although Milne (2005) cannot find such an increase in death rates. The reasons for this increase in death, according to Phillips, do not seem to be the excitement for Christmas but rather overcrowded emergency departments.
Do you Think That the Monetary Value of Presents You are Giving to Your Beloved is of Importance?
In his seminal paper, Waldfogel (1993) discusses whether Christmas entails a welfare loss due to Christmas presents that the receivers do not value as high as givers thought. A lively debate arose amongst economists about the right ways to measure this possible welfare loss, resulting in some researchers showing a welfare gain and others confirming Waldfogel’s welfare loss.6 Even if the discussion on the welfare effect of Christmas is ongoing, some institutional settings should be discussed to solve (potential) welfare loss – Flynn and Adams (2009) show that givers systematically overestimate the importance of the present’s monetary value to the gift-recipient. One solution to this possible welfare problem might therefore be to opt for more humble Christmas presents.
Giving cash would be another economically efficient, but socially inappropriate solution. Therefore gift cards may represent an intermediate between in-kind presents and cash (Offenberg 2007, Principe and Eisenhauer 2009). Offenberg (2007) also finds a welfare loss of 10% for gift cards, as measured by the difference between the face-value of a gift card and the willingness-to-accept –that is the resell price on eBay. So, as long as gift cards also do not seem to be the right solution, humble presents or a wish-list might be an economically reasonable way to reduce a potential welfare loss.
Do You Believe That at Christmas Time the Economy Peaks?
If microeconomic research suggests that Christmas could incur a welfare loss, from a macroeconomic point of view, it might still be a good thing because it “leads to more people working, but faced with a surge of demand, managers somehow manage to get everyone to work smarter and more efficiently even as the total number of workers grows”.7
Several macroeconomists have tested for a so called ‘Santa Claus Effect’ in business cycles, that is, a boom in the fourth quarter and a following trough in the first quarter. Overall the results are mixed, with some papers finding this effect, while others could not – or only in some countries – establish a ‘Santa Claus Effect’.8 More interesting than the question of whether Santa establishes a business cycle is whether such an increase in output and employment in the fourth quarter followed by a contraction the following first quarter is economically efficient.9 Reliable research results on the effects of Christmas on growth are very limited. Maybe the government should smooth the business cycle and decrease spending in the fourth quarter, while increasing spending in the remaining three quarters. In this way, there could be a bit of Christmas every day.
Source
Last week we learned that the key to a strong economy is not increased production, lower unemployment, or a sound monetary unit. Rather, economic prosperity depends on the type of language used by the central bank in its monetary policy statements. All it took was one word in the Federal Reserve Bank's press release – that the Fed would be "patient" in raising interest rates to normal levels – and stock markets went wild. The S&P 500 and the Dow Jones Industrial Average had their best gains in years, with the Dow gaining nearly 800 points from Wednesday to Friday and the S&P gaining almost 100 points to close within a few points of its all-time high.
Just think of how many trillions of dollars of financial activity occurred solely because of that one new phrase in the Fed's statement. That so much in our economy hangs on one word uttered by one institution demonstrates not only that far too much power is given to the Federal Reserve, but also how unbalanced the American economy really is.
While the real economy continues to sputter, financial markets reach record highs, thanks in no small part to the Fed's easy money policies. After six years of zero interest rates, Wall Street has become addicted to easy money. Even the slightest mention of tightening monetary policy, and Wall Street reacts like a heroin addict forced to sober up cold turkey.
While much of the media paid attention to how long interest rates would remain at zero, what they largely ignored is that the Fed is, "maintaining its existing policy of reinvesting principal payments from its holdings of agency debt and agency mortgage-backed securities in agency mortgage-backed securities." Look at the Fed's balance sheet and you'll see that it has purchased $25 billion in mortgage-backed securities since the end of QE3. Annualized, that is $200 billion a year. That may not be as large as QE2 or QE3, but quantitative easing, or as the Fed likes to say "accommodative monetary policy" is far from over.
What gets lost in all the reporting about stock market numbers, unemployment rate figures, and other economic data is the understanding that real wealth results from production of real goods, not from the creation of money out of thin air. The Fed can rig the numbers for a while by turning the monetary spigot on full blast, but the reality is that this is only papering over severe economic problems. Six years after the crisis of 2008, the economy still has not fully recovered, and in many respects is not much better than it was at the turn of the century.
Since 2001, the United States has grown by 38 million people and the working-age population has grown by 23 million people. Yet the economy has only added eight million jobs. Millions of Americans are still unemployed or underemployed, living from paycheck to paycheck, and having to rely on food stamps and other government aid. The Fed's easy money has produced great profits for Wall Street, but it has not helped – and cannot help – Main Street.
An economy that holds its breath every six weeks, looking to parse every single word coming out of Fed Chairman Janet Yellen's mouth for indications of whether to buy or sell, is an economy that is fundamentally unsound. The Fed needs to stop creating trillions of dollars out of thin air, let Wall Street take its medicine, and allow the corrections that should have taken place in 2001 and 2008 to liquidate the bad debts and malinvestments that permeate the economy. Only then will we see a real economic recovery.
Source


