September 12, 2014

The Fed Fails, Um, Does Irony

In a speech in 2002, Bernanke said that the Fed would prevent the US from experiencing a Japan-like outcome.

However, the US has experienced a pattern of economic and policy developments that parallels developments in Japan.

Japan experienced a financial bubble and crisis. The Japanese authorities took actions to support asset prices and prevent insolvent businesses from failing. The growth of the Japanese economy remains so anemic that almost two decades after their financial crisis, the authorities are still introducing new stimulative measures and packages.

The US has also experienced a financial bubble, a crisis, a recession and a very slow recovery. The Fed and the Treasury took unprecedented measures to support asset prices and have prevented or helped to prevent the failure of insolvent firms. Despite the Fed’s opportunity to learn from the Japanese experience and all Fed’s efforts to promote the growth, per capita growth in the US has been slower than in Japan.

In short the US economy has experienced exactly what Bernanke said the Fed could and would prevent, save outright deflation.

In the same speech, Bernanke also said that the Fed could call on other government agencies for help should a financial crisis occur.

Despite Bernanke’s statement that the Fed would be part of a multi-pronged, multi-agency, counter-cyclical response to a serious economic downturn, the Fed has been the only macroeconomic policy game in town. There was no sustained fiscal stimulus, and supporters of the use of fiscal stimulus have argued that the package that was adopted was too small to be effective. Fed-Treasury cooperation during the crisis was limited to the Fed financing the Treasury’s de facto nationalization of AIG. This allowed Treasury to avoid going to Congress for the funding and a debate about the appropriateness and terms of the take-over.

Recently, Bernanke said that monetary policy is no panacea. However, the Fed still insists that a recovery based on monetary stimulus alone is forthcoming.

Again, there is dramatic divergence between what the Fed says or expects on the one hand and actual outcomes on the other.

Before the crisis, the Fed denied the existence of a bubble in residential real estate.

Unfortunately, there was a massive bubble. When the bubble popped, it crippled the financial system and ushered a recession with a slow recovery, high unemployment, and the pain of foreclosures.
The Fed had bet on heads only to have tails come up.

The Fed asserted that a rules-based policy regime was better than one based on discretionary decision making.

However, the rule/discretionary dichotomy has proved to be a false one. Policy makers have exercised discretion when they chose the 1) type of rule, e.g., the Taylor rule versus a nominal GDP target; 2) the variant of the rule employed, e.g., the use of CPI (as favored by Taylor) or forecasts of the PCE deflator (as favored by the Fed); and 3) the sensitivity of policy to deviation of targeted variables from targeted levels.

A truly rules-based, no-discretion-allowed regime would also have rules for when and why the rule should be ignored, as well as a rule that would govern if, who and when the rule can be changed, e.g., from the Taylor rule to nominal GDP targeting. The current regime does have any such rules.

However, the Fed did set interest rate policy in accordance with a variant of the Taylor-Rule. The adoption of this rule-based policy was supposed to insure the continuance of the Great Moderation. Prior to the crisis, FOMC members frequently gave speeches in which they took credit for the Great Moderation. Post the crisis, all we heard from them in effect was: “It cannot be our fault. We were following the rule.” A framework that was supposed to impose discipline and to enhance accountability on policy makers became an alibi for a policy failure.

Again the actual outcomes were the opposite of the outcomes and the goals that the Fed set for itself.

Prior to the crisis, the Fed promoted the idea that a rule-based, inflation-focused policy would make policy design and implementation purely technical problems. This, in turn, would insulate the Fed and its policy from political pressures and insure its independence.

The Fed has not enhanced its independence from political meddling and interference far from it. There is an unusually large amount of political pressure and interference aimed at the Fed and its independence. There are efforts in Congress to 1) require audits of the policy design process, 2) impose a quota system on the Board of Governors of the Federal Reserve System requiring that a seat on the Board be allocated to a community banker, and 3) require the Fed to adhere to a Taylor Rule framework for policy design.

The Fed also opened the door to political meddling when it financed Treasury’s de facto nationalization of AIG and the bailout of AIG counterparties, as well as when it decided to engage in a massive re-distribution of wealth and income via ZIRP.

Once again, the outcome – increased politicalization – was opposite of the desired result.

Prior to the crisis, the Fed said it would not comment on or interfere in the design of fiscal policy in yet another attempt to stay above the partisan political fray.

However, in pursuing ZIRP and QE, the Fed is actively engaged in fiscal policy. ZIRP and QE have lowered the Treasury’s cost of borrowing. The decline in interest rates paid by the Treasury directly affects its outlays and the fiscal deficit. Hence QE has a fiscal policy dimension. It may seem benign today, but when ZIRP and QE are ended the rates paid by the Treasury will rise. Other things equal the fiscal deficit will increase as a result of the policy stance and the Fed will be in a political hot seat.

The Fed is more deeply involved in fiscal policy than ever before. Yet again, the Fed has achieved the opposite of the goal it set out for itself.

The Fed promised to be more transparent than in the past.

In some cases, the Fed is no more and probably less transparent than in the past. The Fed releases numerous point estimates of economic variables, including the staff forecast, the forecasts of individual members of the FOMC, forecast ranges, and central tendencies. In short, a series of often inconsistent forecasts with no confidence limits attached, none of which caught the crisis or the recession and all of which have continuously over-estimated the strength of the recovery. On the other hand, the Fed does not divulge one set of numbers that it knows with certainty and that are of interest to the markets, i.e., the vote tallies at FOMC meetings. If transparency is a goal, why not report the exact vote tallies instead of characterizing the votes as “few, some, many”?

In some cases, the Fed is less transparent. The Fed has never released the rationales for targeted rates of asset purchase under the QEs, nor has it released the rationale behind the pace of tapering of the QE purchases. Policy now emerges from a black box. In addition, the Fed has not specified exactly what the expected goals of the ZIRP and the QE programs was/is. Hence the public has no way of evaluating the success of the programs.

Policy transparency is down and not up.

Prior to the crisis, the Fed attached very little if any importance to its regulatory function. As a result, it failed miserably as a financial regulator.

Despite 1) its failure as a regulator, 2) the fact that its chosen model of the economy (DSGE) does not even contain financial institutions or markets, 3) the policy rule that it employed prior to the crisis as well as the leading alternatives do not reflect financial market developments, and 4) the fact that it only pays lip service to financial stability when setting policy, its regulatory reach was expanded.

The Fed now acknowledges that regulation is important. This is precisely the opposite of what the Fed had assumed. The expansion of the Fed’s regulatory reach is the opposite of what the Fed would have argued was necessary, as well as the opposite of what the record suggests is appropriate. Alternatively, one could argue that after resisting changes the Fed has suffered a de facto loss of regulatory authority, even as its regulatory reach outside the banking sector has been expanded.

In its role as a financial regulator, the Fed presents itself as having expertise in risk management.

When ZIRP did not work to the Fed’s satisfaction, the Fed doubled down with QE1. When QE1 did not work to the Fed’s satisfaction, the Fed doubled down with QE2. And when QE2 didn’t work to the Fed’s satisfaction, it doubled down with QE3. This despite a running debate on exactly and to what extent QE has stimulated the real economy.

Furthermore, the Fed says that it should not lean against asset price bubbles because it can never be certain there is an asset price bubble. However, the Fed cannot know with certainty that there isn’t an asset price bubble either. Nonetheless, it sets policy as if an asset price bubble does not exist or are of no concern.

With a sustained satisfactory rate of growth still illusive, signs of excesses in the capital markets, no agreed upon plan to shrink the size of its balance sheet and with the Fed already in a political hot seat, society and the Fed have more on the table than they can afford to lose. The Fed has demonstrated all the risk management acumen and discipline of the London Whale.

The Fed asserts, based on its expertise and knowledge of the economy, that the markets, financial institutions and society as whole should base their behavior on its forecast for the economy, interest rates and inflation.

However, better-credentialed individuals (former full professors at prestigious universities with Nobel Prizes in economics to boot) running a fixed income portfolio at LTCM managed to make errors that threatened the US financial system in 1998. This occurred despite all the credentials and the fact that managing a fixed income portfolio is a trivial problem compared to setting and implementing macroeconomic policy.

Given that episode, the Fed’s failure to foresee the financial crisis, and the repeated incorrect calls for acceleration in growth a few quarters out, why does the Fed assume that economic agents will treat its forecast as gospel and alter their behavior beyond the impact of the interest rate stance?

The Fed employs models that assume rational expectations and efficient markets, but its assertion that current policy pronouncements can manipulate expectations implicitly assumes that economic agents do not remember or learn from the recent past.

The economic and financial systems are complex and dynamic. The fact that the Fed did not achieve all the goals that it set out for itself is not surprising. However, is more than just ironic that the Fed made decisions and pursued policies which resulted in it achieving the opposite of its stated goals and forecasted outcomes.

September 11, 2014

Goldman Declares The "End Of The Iron Age"

Back in the summer of 2008, when crude seemed poised to take out $150, Goldman decided to declare the start of a commodity supercycle and boosted its oil price forecast to $200. Shortly thereafter crude cratered, plunging to the low double digits, and causing many to scratch their heads whether Goldman was merely taking advantage of the pre-Lehman panic to sell into the euphoria. The same questions, but inverted, will likely follow today's just as seminal note, one which this time calls for the end of a supercycle, this time of iron, with "The end of the Iron Age."

While intuitively this makes sense considering iron ore prices have tumbled nearly 40% YTD and were at multi-year lows at last check with the demand picture going from bad to atrocious, the reality is that a protracted period of deflation in this key commodity will have very adverse implications for not only China, where CapEx amounts to over half of GDP and will likely force the transition to a consumer-driven economy - something the Politburo has been delaying for years - but for the rest of the commodity suppliers countries, with the most negative impact hitting Brazil and Australia. Worse, for a country like China which has thrived on commodity oversupply and overcapacity, the collapse in the equilibrium price driven largely by demand, will mean thousands of suppliers will be left out in the cold and forced to liquidate with massive ripple effects through the fabric of the Chinese economy.

To be sure, for the time being local governments, banks and other SOEs, and the central bank, have been successful in isolating the assorted pockets of deflation that has hammered China in the past several years, but if Goldman is correct and if indeed a iron (and other commodities) are shifting from the "Investment Phase" to the "Exploitation Phase" as Goldman calls it, then watch out below not only China, but the rest of the world as well.

So what exactly does Goldman say?  Let's dig into their latest note:

The end of the Iron Age

Producers and investors have enjoyed a long period of supply tightness, cost inflation and above trend profitability; in our reports we have referred to this period as the Iron Age. In our view, 2014 is the inflection point where new production capacity finally catches up with demand growth, and profit margins begin their reversion to the historical mean; in other words, the end of the Iron Age is here.
Iron ore has entered a new exploitation phase

As we have previously argued3, a period of overinvestment in production capacity has ended, giving way to an exploitation phase where supply growth comes mainly from more efficient utilization of existing capacity. Production volumes grow with a certain time lag behind the investment decision; the lag in the mining industry between investment approval and production at full capacity is typically between 5 and 10 years. Based on historical trends, we believe that many market dynamics are reversed in the shift from investment to exploitation, and the current exploitation phase in iron ore could last for a decade (Exhibit 20).

On the demand side, lower prices for iron ore and steel are unlikely to boost demand in a material way. Instead, the day when steel production in China will peak gets  ever closer. In the past decade, the Chinese economy added steel to its economy at a rate three times faster than the US did during the 20th century. On a per capita basis, the average household in China is accumulating steel at a rate equivalent to the purchase of a new car every 8 months (without disposing of its older cars). In other words, the volume of steel stock in China is racing towards the US level of 13 tonnes per person (Exhibit 21). If China is to converge towards the US level, steel consumption will eventually have to stabilize and steel recycling will play a larger role.

On the supply side, the capital stock of the iron ore industry in Australia, Brazil and China increased by US$180 billion during the period 2003-12; this will fuel production growth for years to come (Exhibit 22). Now that the market has transitioned to an exploitation phase we expect new approvals for capital intensive projects to become increasingly rare, largely because the economics of greenfield projects will be challenging in an oversupplied market. However, projects approved in the later stages of the investment phase will support production growth in the years ahead, and low cost brownfield expansions at Tier 1 producers will remain attractive.

Can prices recover once marginal supply is gone? We don’t think so

In principle, the displacement of marginal producers should eventually lead to a balanced market with a high level of concentration among the top 4 miners, raising the prospect of a price recovery further down the road. In practice, we believe that market fundamentals will continue to see supply growth outpacing demand growth by a ratio of 3 to 1 over our forecast period. Not only is the growth pipeline set to deliver several large projects over our forecast period (Minas Rio, Roy Hill, Serra Sul as well as large expansions at Rio Tinto and BHP Billiton), but the supply side will also have many idled mines waiting on the sidelines and ready to resume production should prices recover.

Moreover, iron ore markets went through a 20-year period of declining prices in real terms during the previous exploitation phase that ended in 2004. The iron ore price in 2003 was the same as in 1983 in nominal terms; this is equivalent to an annual deflation rate of 3% in real terms (Exhibit 23). In our view, iron ore prices will display a similar trend of cost deflation in the current exploitation phase.

Cost curves become flatter via the loss of marginal supply and they shift downwards via rising productivity and weaker commodity currencies. Commodity currencies have started to depreciate relative to the US dollar; the weighted average across five of the largest seaborne exporters has lost 16% since January 2011 (Exhibit 24). Given that a majority of production costs are denominated in local currency, this has a direct impact on the level of marginal production costs. On the productivity front, the increased focus on efficiency and the ramp-up of production has already resulted in a modest decline in unit costs among some producers; we expect this trend to continue.

Many moving parts but China remains the key question

The veil on Chinese iron ore production and the level of cost support it would provide to seaborne prices was supposed to be lifted as the market moved into surplus during 2014. But instead of a clear answer, recent data from China only raise further questions regarding the scale of the supply response low prices. In the seaborne market, the delivery of new projects in Australia and Brazil more than offsets the closure of marginal producers. Meanwhile, slower growth in low grade ore supply should see grade discounts normalise.

Chinese riddle: making sense of production statistics

The Chinese iron ore sector is highly fragmented and the data on supply trends is rather limited, but official statistics on price and volume have been roughly consistent in the past: high domestic prices coincided with growth in raw ore production, while market corrections in 2H 2012 triggered production cuts among marginal miners. On that basis, the recent decline in domestic concentrate prices should have led to another deceleration or even contraction in raw ore volumes. Instead, NBS statistics suggest that volume growth has accelerated (Exhibit 3). We find this highly counterintuitive. First, media reports from Platts and other sources indicate that many small mines stopped production from Q2 2014 onwards. Second, a rising volume of domestic ore would be inconsistent with the reported statistics on steel production and iron ore imports which show high growth in Fe supply but low growth in Fe consumption (Exhibit 4).

What does this all mean? We consider the following hypotheses:
  • Official statistics do not reflect actual iron ore production. Provincial governments may set GDP or tax revenue targets at the start of the year, and set iron ore production estimates accordingly.
  • Official statistics only capture some production. The smallest miners may slip through the cracks if they fall below the threshold used in data collection, preventing the closure of small private mines from appearing in official statistics.
  • Production can cut at the concentrator rather than the mine. Mines may choose to suspend sales to concentrators but continue to operate in order to minimize disruption to their operations.
In our view, a combination of these factors could be responsible for the muddied picture, forcing us to look for alternative ways to assess current trends in Chinese iron ore supply. One option is to calculate the implied production of iron ore from statistics on crude steel production and iron ore imports. Taking into account the changes in iron ore inventory and the modest variations in the grade of imported ore, this analysis suggests that Chinese iron ore production on a 62% Fe basis grew during Q1 (partly reflecting limited disruption from a mild winter) before contracting in the following quarter; implied production in the year to July is down 11% yoy (Exhibits 5 and 6). Importantly, the timing of this contraction coincides neatly with the decline in the price of domestic concentrate in Hebei.

Industry sources also suggest that some Chinese supply has been displaced. The MySteel survey shows that utilization rates began to drop in May 2014 when the domestic price of concentrate was heading towards Rmb900/t, with the smallest mines reporting the lowest rates of utilization (Exhibit 7). Meanwhile, the consensus view at a recent conference on Chinese iron ore was that many private mines had indeed closed, even if the aggregate impact on production was limited due to their small size. However, producers also indicated that efforts to expand domestic production are ongoing, as implied by the volume of investment in the sector (Exhibit 8).

Given this wide range of sometimes conflicting indicators, we assume that future Chinese iron ore production would remain roughly stable before mine closures, as new projects and depletion at existing mines offset each other. We continue to assume that the average grade mined in China will remain stable at c. 20% Fe based on a) the reported grade of new projects and b) the fact that closures are likely to affect mines with below-average grades the most. After factoring in mine closures, we forecast domestic production to decline by c.9% per year on a Fe adjusted basis.

September 10, 2014

A Historic First: Bank Of Japan Monetizes Debt At Negative Rates

First, Europe infamously shifted to a NIRP and now Japan has begun NIRP monetization. As WSJ reports, Tuesday marked another milestone in the topsy-turvy world of monetary easing in Japan: The Bank of Japan bought short-term Japanese government debt at a negative yield for the first time. In the understatement of the decade, one Japanese bank strategist noted, "The BOJ probably didn't expect this would happen, and T-bill rates staying negative should be a cause of concern for them." The BoJ's decision to scoop up these negative-yielding bills appears to confirm they will meet the QQE-buying demands no matter what the cost (to the Japanese people). The bottom line, the Bank of Japan is now implicitly issuing debt to the Japanese Treasury.

The BOJ scooped up some of the three-month No. 477 Treasury bill, which has traded at a negative yield for the past two trading days amid strong demand, the market participants said.

Traders said the bank wanted to show the market that it would meet its asset purchase goals–literally at whatever the cost.

Market participants say the bank probably didn’t foresee buying Japanese debt at negative yields. But the European Central Bank’s easing has created demand for short-term Japanese debt from European investors, to the extent that interest rates have turned negative.

“The BOJ probably didn’t expect this would happen, and T-bill rates staying negative should be a cause of concern for them,” said Shogo Fujita, chief Japan bond strategist at Merrill Lynch Japan Securities Co.
So, in summary, normally, people who buy debt expect to get their money back plus some interest. Negative yield means the buyer gets back less than he or she puts in.

In other words, the Bank of Japan is now ISSUING debt TO the Japanese Treasury.

September 9, 2014

Losing Credibility – The IMF’s New Cold War Loan to Ukraine

In April 2014, fresh from riots against the kleptocrats in Maidan Square and the February 22 coup, and less than a month before the May 2 massacre in Odessa, the IMF approved a $17 billion loan program to Ukraine’s junta. Normal IMF practice is to lend only up to twice a country’s quota in one year. This was eight times as high.

Four months later, on August 29, just as Kiev began losing its attempt at ethnic cleansing against the eastern Donbas region, the IMF signed off on the first loan ever to a side engaged in a civil war, not to mention being rife with insider capital flight and a collapsing balance of payments. Based on fictitiously trouble-free projections of the ability to pay, the loan supported Ukraine’s currency, the hryvnia, long enough to enable the oligarchs’ banks to move the money quickly into Western hard-currency accounts before the hryvnia plunged further and was worth even fewer euros and dollars.

This loan demonstrates the degree to which the IMF is an arm of U.S. Cold War politics. The loan terms imposed the usual budget austerity, as if this would stabilize the war-torn country’s finances. The financings obviously were devoted mainly to rebuilding the army. The war-torn East can expect to receive nothing even nothing even though its basic infrastructure has been destroyed for power generation water, and hospitals. Civilian housing areas that bore the brunt of the attack are also unlikely to profit from the IMF’s uncharacteristic generosity.

A quarter of Ukraine’s exports normally are from eastern provinces and sold mainly to Russia. But Kiev has been bombing Donbas industry and left its coal mines without electricity. Nearly a million civilians are reported to have fled to Russia. Yet the IMF release announced: “The IMF praised the government’s commitment to economic reforms despite the ongoing conflict.” No wonder there was almost no comment in the news or even the business press!

The loan is bound to create even more infighting among IMF staff economists than broke out openly at their October 2013 annual meeting in Washington. Dissension over the disastrous IMF $47 billion loan to Greece – at that time the largest loan in IMF history – prompted a 50-page internal IMF document leaked to the Wall Street Journal. Acknowledging that the IMF had “badly underestimated the damage that its prescriptions of austerity would do to Greece’s economy,” IMF staff economists blamed pressure from eurozone countries protecting their own “banks [that] held too much Greek government debt. … The IMF had originally projected Greece would lose 5.5% of its economic output between 2009 and 2012. The country has lost 17% in real gross domestic output instead. The plan predicted a 15% unemployment rate in 2012. It was 25%.

The IMF’s Articles of Agreement forbid it to make loans to countries that clearly cannot pay, prompting its economists to complain at their Washington meeting that their institution was violating its rules by making bad loans “to states unable to repay their debts.” One official called its Debt Sustainability Analysis, “‘a joke,’ a [European] commission official described it ‘a fairy tale to put children to sleep’ and a Greek finance ministry official said it was ‘scientifically ridiculous.’” In practice the IMF simply advanced however much a country needed to pay its bankers and bondholders, pretending that more austerity would enhance the ability to pay, not worsen the debt trap, while Kiev also used the loan for military expenses to attack the Eastern provinces.

This raises the question of whether the IMF’s loan is legally an “odious debt,” being made to a military junta and stolen by government insiders. John Helmer’s Dances with Bears calculates that “of the $3.2 billion disbursed to the Ukrainian treasury by the IMF at the start of May, $3.1 billion had disappeared offshore by the middle of August.”

Unlike the IMF’s most recent disastrous loan to Cyprus, the IMF did not reveal its reasoning. But it made it clear that the National Bank of Ukraine (NBU) – its central bank – was simply turning money over to the kleptocrats who ran the country’s banks as part of their conglomerates, and funding the government’s military attack on the East: “The proportion of government securities and loans to banks increased from 28 percent of NBU total assets at end-2010 to 56 percent at end-April 2014.” The financial situation was getting worse. Facing rising insolvency risks, Ukraine’s leading banks were reported to need another $5 billion over and above the IMF’s $17 billion commitment.

In preparation for October’s scheduled elections, the eastern provinces are in no condition to vote, and the junta has banned the Communist party and also banned TV and media reporting that it does not like. The leading pro-war parties are polling very low even in the West (as of early September). There are warnings of a coup by the Right Sector and allied neo-Nazi Ukrainian nationalists, headed by the oligarch Ihor Kolomoyskyy, who has fielded his own private army. From Johnson’s Russia List* (no online version):
A defeat in war frequently leads to regime change. The spectre of a coup is once again roaming the streets and squares of Kyiv. Surviving National Guard fighters are threatening to turn their weapons on Poroshenko. A third Maydan [Independence Square protest movement] is taking shape, which is to sweep aside the present regime. The instigators of this Maydan are militants from the punitive battalions created with Kolomoyskyy’s money. It is obvious that the oligarch is playing his game against Poroshenko. Subordinate to him Kolomoyskyy has quite a strong private army capable of carrying out a coup.

IMF- and US-backed Privatization Plans for Ukraine

Ukraine’s main problem is that its debt is denominated in dollars and euros. There seems only one way for Ukraine to raise the foreign exchange to repay the IMF and NATO creditors rounded up to help Westernize the economy: by selling its natural resources, headed by gas rights and agricultural land.

Here the shadowy figure of Kolomoyskyy resurfaces, with support from the United States. Recent Senate Bill 2277 “directs the U.S. Agency for International Development to guarantee loans for every phase of the development of oil and gas” in Ukraine, Moldova and Georgia.

Vice President Biden’s son, R. Hunter Biden, recently was appointed to the board of Burisma, a Ukrainian oil and gas company registered in Cyprus, long a favorite for post-Soviet operators. The firm has enough influence over Kiev politics to make prospective gas fracking lands a military objective. From the PEU, citing an Economic Policy Journal report**:
Ukrainian troopers help installing shale gas production equipment near the east Ukrainian town of Slavyansk, which they bombed and shelled for the three preceding months, the Novorossiya news agency reports on its website citing local residents. Civilians protected by Ukrainian army are getting ready to install drilling rigs. More equipment is being brought in, they said, adding that the military are encircling the future extraction area.
The Western press has failed to convey Ukraine’s East/West hostility to the gas and agricultural issues, but one report notes: “The people of Slavyansk, which is located in the heart of the Yzovka shale gas field, staged numerous protest actions in the past against its development. They even wanted to call in a referendum on that subject. … Countries like the Czech Republic, the Netherlands and France have given up plans to develop shale gas deposits in their territories. Not only them but also all-important Germany, which two weeks ago announced it would halt shale-gas drilling for the next seven years over groundwater pollution concerns.” U.S. and IMF backing seems intended to help reduce European dependence on Russian gas so as to squeeze its balance of payments as part of the New Cold War deterrent.

But it has involved a potentially embarrassing U.S. alliance with Kolomoyskyy as reportedly the major owner of Burisma through his Privat Bank. Robert Parry points out he “was appointed by the coup regime to be governor of Dnipropetrovsk Oblast, a south-central province of Ukraine. Kolomoysky also has been associated with the financing of brutal paramilitary forces killing ethnic Russians in eastern Ukraine.”

The other natural resource to be sold off is farmland. Already there is heavy Monsanto investment in genetically engineered grain. A recent report by the Oakland Institute, Walking on the West Side: the World Bank and the IMF in the Ukraine Conflict, describes pressure to deregulate Ukrainian agricultural land use and promote its sale to U.S. and other foreign investors. In particular it notes that “IFC advised the country to ‘delete provisions regarding mandatory certification of food in the listed laws of Ukraine and Government Decree,’” and “to avoid ‘unnecessary cost for businesses’” by regulations on pesticides, additives and so forth.

What makes this so puzzling is that neither Russia nor many European countries accept genetically engineered foods. It would seem that the only way Ukraine can export this food is if U.S. diplomats pressure Europe to drop its anti-GMO labeling. This threatens to drive yet another wedge between the United States and European NATO members.

It will be expensive to restore power and water facilities that have been destroyed by the Kiev forces in Donetsk, which faces a cold dark winter. Kiev has stopped paying pensions and other revenue to the Eastern Ukraine, all but guaranteeing its separatism. Even before the Maidan events the local population sought to prevent gas fracking, just as Germany and other European countries have opposed it. Also opposed is the appropriation of land and other properties by Ukrainian kleptocrats and especially foreigners such as Monsanto for genetically modified seeds – again, just as Germany and other European countries have opposed crops produced by GMOs.

U.S. Stratagems to Save Ukraine from Having to Pay Its Debts to Russia

The “inner contradiction” in the IMF loan is that Ukraine owes the entire amount to Russia for gas arrears and current needs as winter nears, and also for the euro loan by Russia’s sovereign wealth fund on strictly commercial terms with cross-defaults if Ukrainian debt rises above 60 percent of GDP. Yet U.S. Cold War strategy is to minimize payments to Russia out of IMF and NATO “reconstruction” lending.

In the wake of the New Cold War confrontation in mid-2014 after Russia re-absorbed Crimea, the Peterson Institute for International Economics, floated a proposal by former Treasury official Anna Gelpern to deprive Russia of legal means to enforce its claims on Ukraine. “A single measure can free up $3 billion for Ukraine,” she proposed. Britain’s Parliament might pass a law declaring the $3 billion bond negotiated by Russia’s sovereign wealth fund to be “foreign aid,” not a real commercial loan contract worthy of legal enforcement. “The United Kingdom can refuse to enforce English-law contracts for the money Russia lent,” thereby taking “away creditor remedies for default on this debt.”

The problem with this ploy is that Russia’s sovereign wealth fund lent Ukraine euros with strict financial protection aimed at limiting the country’s overall debt to just 60 percent of its GDP. If debt rises above this level, Russia has the right to demand full immediate payment, and this may trigger cross-default clauses in Ukraine’s foreign debt.

As recently as yearend 2013, Ukraine’s public debt amounted to just over 40 percent – a seemingly manageable $73 billion. But in view of the fact that Ukraine had only a B+ rating – below Russian sovereign fund normal limit of requiring at least an AA rating for bond investments – Russia seems to have acted in a prudent financial way in inserting protection clauses precisely to distinguish its investment from general purpose aid.

Waging civil war is expensive, and Ukraine’s currency is rupturing. The black market exchange rate already is reported to have plunged by one-third. If recognized officially (once the kleptocrats have moved their money out at IMF-supported hernia rates), this would raise the country’s debt/GDP ratio to the 60 percent threshold making the debt to Russia payable immediately. Unlike foreign aid, Russia’s loan gives it “power to trigger a cascade of defaults under Ukraine’s other bonds and a large block of votes in any future bond restructuring. This is because all of the government’s bonds are linked among themselves. When one bond defaults, the rest can do the same.”

What the U.S. Government classifies as foreign aid also typically takes the form of loans to be repaid, and insists on matching funds in local currency, e.g. for Public Law 480 food exports. Congress insisted already during the Kennedy Administration that the U.S. balance of payments, and specifically its farm exports, must benefit from any such “aid.”

Reviewing the possibilities of how to prevent IMF and NATO credit from being paid to Russia for its bondholdings and gas arrears, Prof. Gelpern points out that “governments do not normally sue one another to collect their debts in national courts.” If this should occur, the pari passu rule would prevent some debts from being annulled selectively. She therefore raises another possibility – that Ukraine may claim that its debt to Russia is “odious,” addressing the situation where “an evil ruler signs contracts that burden future generations long after the ruler is deposed.” She suggests that “Repudiating all debts incurred under Yanukovich would discourage lending to corrupt leaders.”

The double standard here is that instead of labeling Ukraine’s long series of kleptocratic governments odious, she singles out only Yanukovich, as if his predecessors and successors are not equally venal. But an even greater danger in declaring Ukraine’s debt “odious”: It may backfire on the United States, given its long support for military dictatorships and kleptocracies. Ukraine’s sale of bonds to Russia’s sovereign debt fund and its contracts signed for gas purchases were negotiated by a democratically elected government, at prices that subsidized domestic industry and also household consumption. Unlike the case with Greece, there was no removal of a national leader to prevent a public referendum from taking place over whether to approve the loan or not. If this debt is deemed odious, what of Eurozone loans to Ireland and Greece or U.S. loans to Argentina’s generals installed under Operation Condor?

Gelpern acknowledges that Ukrainian refusal to pay the bonds by invoking the odious debt principle “is fraught with legal, political and market risks, all of which would play into Russia’s hands.” This leaves the most promising solution to hurt Russia to be the above-mentioned ploy for Britain’s Parliament to pass a sanctions law invalidating “the Yanukovich bonds.” Such a sanctions law would reduce Russia’s “ability to profit from selling the debt on the market” simply by denying Russia legal rights to grab Ukrainian assets.

Gelpern concludes her paper by suggesting a universal principle: that contracts “used to advance military and political objectives … should lose their claim to court enforcement.” This opens a can of worms in view of the fact that “[t]he United Kingdom and the United States have both used military force in the past to collect debts and influence weaker countries. Is it legitimate for them to punish Russia for doing the same?” Are not the vast majority of inter-governmental debts either military or political in character? On this logic, shouldn’t most inter-governmental debts be wiped out? Do not Gelpern’s arguments cited for not paying Russia serve even more to provide a legal basis for nullifying Ukraine’s debt to the IMF and subsequent NATO loans on terms that force it to forfeit its natural resource rights for gas and land to foreign investors?

The legal review ostensibly seeking reasons to isolate Russia economically thus has the seemingly ironic effect of showing the legal and political difficulties in trying to achieve this. If Ukraine borrows from the IMF and/or EU, and then breaks up – with the East becoming independent – who will be obliged to pay? Certainly not the East, attacked by the military coup leaders.

So we are brought back to this month’s financial news in preparation for next month’s IMF annual meeting: Where then does the Ukrainian loan leave the IMF’s credibility?

September 8, 2014

If The Economy Is Recovering, Why Is The Labor Force Participation Rate At A 36 Year Low?

Should we be concerned that the percentage of Americans that are either working or looking for work is the lowest that it has been in 36 years?  In August, an all-time record high 92,269,000 Americans 16 years of age and older did not "participate in the labor force".  And when you throw in the people that are considered to be "in the labor force" but are not currently employed, that pushes the total of working age Americans that do not have jobs to well over 100 million.  Yes, it may be hard to believe, but there are more than 100 million working age Americans that are not employed right now.  Needless to say, this is not a sign of a healthy economy, and it is a huge reason why dependence on the government has soared to absolutely unprecedented levels.  When people can't take care of themselves, they need someone else to take care of them.  If the percentage of people in the labor force continues to decline like it has been, what is that going to mean for the future of our society?

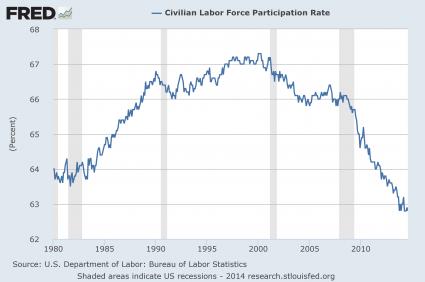
The chart below shows the changes in the civilian labor force participation rate since 1980.  As you can see, the rate steadily rose between 1980 and 2000, but since then it has generally been declining.  In particular, this decline has greatly accelerated since the beginning of the last recession...

Labor Force Participation Rate

We have never seen an extended precipitous decline of this nature before.  But instead of admitting that we have a very serious problem on our hands, many mainstream economists are dismissing this decline as "structural in nature".  For example, check out the following excerpt from a recent Reuters article...
A paper published on Thursday by the Brookings Institution, a Washington-based think tank, suggested the decline was primarily due to an aging population and other structural factors, and concluded the labor force would continue to shrink.
But there is a major flaw in this analysis.  It turns out that older Americans are the only group for which employment numbers have actually been going up.  I really like how Zero Hedge made this point the other day...
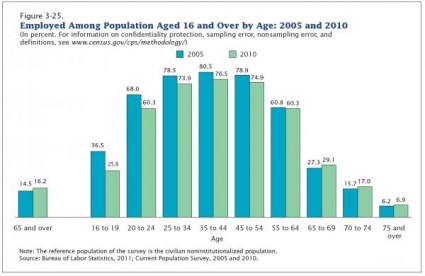
Well that's very odd, because it was only two months ago that the Census wrote the following [5]: "Many older workers managed to stay employed during the recession; in fact, the population in age groups 65 and over were the only ones not to see a decline in the employment share from 2005 to 2010 (Figure 3-25)... Remaining employed and delaying retirement was one way of lessening the impact of the stock market decline and subsequent loss in retirement savings."
Figure 3-25
Yes, Baby Boomers are hitting retirement age.

But that does not explain why the labor force participation rate numbers for younger groups have been going down.

Each month, the U.S. economy has to add somewhere between 100,000 and 150,000 jobs just to keep up with population growth.  Since job creation has been tepid at best in recent years, the only way that the government has been able to get the official unemployment rate to steadily "go down" has been to remove millions upon millions of Americans from the labor force.

According to the official government numbers, since 2007 768,000 jobs have been added to the economy, but a whopping 13 million Americans have been added to the numbers of those "not in the labor force".

As a result, the official unemployment rate has magically been "declining".

But the truth is that our employment crisis has not been solved at all.

And it isn't just the number of jobs that we need to be concerned about.  We are also dealing with a multi-year decline in the quality of our jobs.  In fact, the Wall Street Journal just reported that 34 percent of all U.S. workers are "freelancers" now...
More evidence that this isn’t your parents’ labor market: Roughly one in three U.S. workers is now a freelancer. 
Fifty-three million Americans, or 34% of the nation’s workforce, qualify as freelancers, according to a new report from the Freelancers Union, a nonprofit organization, and Elance-oDesk Inc., a company that provides platforms for freelancers to find work. These individuals include independent contractors, temps, and moonlighters, among others.
In other words, about a third of all workers in the country are "temps" at this point.
I don't know about you, but to me that is an extremely alarming statistic.

If the economy really was recovering, this would not be happening.

And as millions upon millions of Americans are being forced out of the official labor force, an increasing number of people are turning to the underground economy.

For example, in some of our major cities we are witnessing a rise in the number of street vendors.  The following is an excerpt from a recent Los Angeles Times article entitled "More Angelenos are becoming street vendors amid weak economy"...
Sitting at her street vending booth with products arrayed neatly on a sequined purple tablecloth, Jackie Lloyd reflects nostalgically on the days when she had a steady salary and regular hours. 
That was four years ago, before the 39-year-old was laid off from her job as an elementary school cafeteria worker and mounting bills forced her to venture into self-employment. 
Now the Pico-Union resident hops from location to location, selling body oils, shea butter, soap and incense. She moves when nearby businesses complain or she feels unsafe. 
Some days, her sales bring in $150. Others, they don't break $20.
In order to have a strong middle class, we need middle class jobs.

If our labor force participation rate continues to fall and the quality of our jobs continues to decline, the middle class will continue to shrink.  For much more on this, please see my previous article entitled "30 stats to show to anyone that does not believe the middle class is being destroyed".

But our authorities never seem to want to admit what our real problems are.

Instead, they love to come up with alternative theories for our economic struggles.

One of the latest theories being put forward by the Federal Reserve is that the economy is not moving along like it should because ordinary Americans are "hoarding money"...
One of the great mysteries of the post-financial crisis world is why the U.S. has lacked inflation despite all the money being pumped into the economy. 
The St. Louis Federal Reserve thinks it has the answer: A paper the central bank branch published this week blames the low level of money movement in large part on consumers and their "willingness to hoard money."
This seems completely absurd to me.

From what I can see, most families are just doing their best to survive from month to month these days.

I certainly don't see a lot of people "hoarding money".

What about you?

What do you think?

September 5, 2014

Most People Don’t Believe It, But We Are Right On Schedule For The Next Financial Crash

People have such short memories.  Even though we are repeating so many of the same patterns that we witnessed in 2000-2001 and 2007-2008, most people do not think that another financial crash is coming.  In fact, with the stock market setting record high after record high lately, I have been taking quite a bit of criticism for my relentless warnings about the coming financial storm.  Many of the comments go something like this: "Snyder you are a moron!  Nothing you say ever comes true.  The stock market is going to keep on rocking and Obama is going to lead this country back to greatness.  I hope that you choke on all of your doom and gloom."  Of course these critics never offer any hard evidence that I have been wrong about anything.  They just assume that since the stock market has soared to unprecedented heights that all of us "bears" must have been wrong.

But the truth is that what we are observing right now is classic bubble behavior.  The stock market crashes of 1929, 1987 and 2008 were all preceded by irrational market rallies in the spring or summer.  The financial markets have become completely divorced from economic reality, and such a state of affairs never lasts forever.  It is just a matter of time before a correction comes.

But every time there is a bubble, most people end up getting caught up in all of the euphoria.  And it is happening again.  In fact, CNBC has just reported that bearishness among market newsletter writers is the lowest that it has been since 1987.  But of course we all remember what happened back in 1987...
Professional investors haven't had this little fear about stocks since Ronald Reagan was president. 
It was the same year Michael Jackson told us in a song he was "Bad." The New York Giants won the Super Bowl. 
And oh yeah ... by the way ... the stock market crashed. 
As gauged by the weekly Investors Intelligence report, bearishness among market newsletter writers has fallen to 13.3 percent, a level it has not seen since 1987 as the market continues to set new highs despite a seemingly endless call for a long-overdue correction.
People need to understand that just because something has not happened yet does not mean that it is not going to happen.

In this day and age, we have extremely short attention spans and we do not have the patience to wait for much of anything.  But the financial world is not a game of checkers.  It is a game of chess where things can take an extended period of time to play out.

Those that are mocking those of us that are bearish should consider where we stand financially in comparison to previous crash cycles.  For example, the derivatives bubble is 20 percent larger than it was back in 2008, the "too big to fail banks" are 37 percent larger than they were back in 2008 and global debt levels are 40 percent larger than they were back in 2008.

In other words, many of our long-term economic problems are a lot worse than they were just prior to the last major financial meltdown.

But most people pay such little attention to the fundamentals these days.  All they can see is that little stock market ticker going up and up and up.

Other analysts with much stronger credentials than I are issuing similar ominous warnings about what is ahead for the financial markets.

For example, Nobel Prize-winning economist Robert Shiller is warning that market valuations are tremendously bloated right now...
Shiller, a Yale University professor who is often cited as one of the most influential people in economics and finance in the world, created a metric that compares stock prices with corporate profits. The metric recently climbed above 25. That level has only been surpassed three times since 1881: 1929, 1999 and 2007. 
Steep market tumbles followed each instance, including the bursting of the dotcom bubble in the early 2000s.
But it doesn't take a genius to see this.

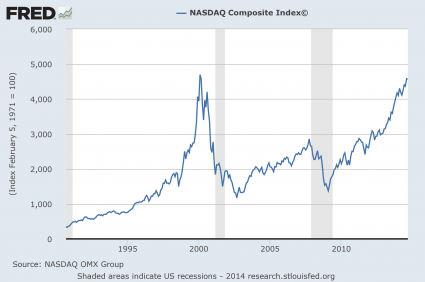
Just look at the chart of the NASDAQ that I have posted below.  The "dotcom bubble" in 2000 is really easy to see.  So why can't more people recognize the bubble that is happening now?...

NASDAQ Chart

In so many ways this bubble is reminiscent of the "dotcom bubble" of 14 years ago.  Consider the following numbers from a recent article by Brett Arends...
When you look at medians, or in other words the typical stock, valuations are higher today than they were at the peak in 1999-2000. 
For example, the median stock today is 20 times earnings. In January 2000, it was 16 times. 
The median stock today trades at 2.5 times “book” or net asset value. At the start of 2000 it was just 2.2 times. 
The median stock today trades for 1.8 times annual per-share revenues. In 2000: just 1.4 times.
What we are experiencing is not normal.

And this is especially true considering the fact that our overall economic performance is tepid at best.

A stock market correction is coming.

But you don't have to take my word for it.  Some of the most prominent names in the financial world are warning about the coming correction.  Two of them were recently interviewed by CNBC...
A jolt to international confidence in central banks will lead to a 30 to 60 percent market decline, David Tice, president of Tice Capital and founder of the Prudent Bear Fund, told CNBC's "Power Lunch." When this happens, he said, markets will face a "period of extreme turmoil." 
This crash will be precipitated, he said, by a disillusionment with the Federal Reserve's "confidence game," which will then see inflation rise, and the Fed scramble to raise rates. At that point, Tice added, "the Fed starts to lose control."
Another market watcher also called for an impending fall. 
The Fed's low interest rates could bring a "scary" 50-60 percent market correction, said technical analyst Abigail Doolittle. 
"Unfortunately, I think it could come on a crash similar to what happened in 2007," Doolittle, the founder of Peak Theories Research, said on "Squawk Box" a day after the S&P 500 closed above the 2,000 level for the first time ever. "It's tough to know what the exact catalyst will be. But that's the very nature of that kind of selloff. They start slowly and then happen very suddenly."
And as Zero Hedge has pointed out, billionaires such as Sam Zell, George Soros, Stan Druckenmiller and Carl Icahn all seem to be "quietly preparing" for the next crash.

Yes, the next financial crash has taken longer to come to fruition than many had anticipated.  But as I have discussed so many times before, this is a very good thing.  We should want this period of relative stability to last for as long as possible.  The longer that things remain relatively stable, the longer that all of us have to prepare and to position ourselves for the financial chaos that is coming.

At this point, the fact that we are in the midst of a massive financial bubble has become so obvious that even the Bank for International Settlements is publicly talking about it...
Financial markets have been exuberant over the past year, [...] dancing mainly to the tune of central bank decisions. Volatility in equity, fixed income and foreign exchange markets has sagged to historical lows. Obviously, market participants are pricing in hardly any risks.
Many have expected me to "change my tune" about the coming collapse because of how well the stock market has been performing.

Well, that simply is not going to happen.

Our economic fundamentals have continued to deteriorate, and our financial system is in far worse shape than it was just prior to the financial crash of 2008.

The truth is that we are right on schedule for the next great financial crash.

You can choose to ignore the warnings if you would like, but ultimately time will reveal who was right and who was wrong.

September 4, 2014

"A Printer And A Prayer" - The Three Problems With The Fed "Liquidity Coverage Ratio" Plan

A little over a week ago we wrote that in order to mitigate problems arising from record debt and soaring NPLs, the G-20 had a modest proposal for global banks: more debt. Specifically "in November said leaders will agree "that the world's top banks must issue special bonds to increase the amount of capital which can be tapped in a crisis instead of calling on taxpayers to come to the rescue, industry and G20 officials said." In other words, suddenly the $2.8 trillion in Fed injected excess reserves, split roughly equally between US and European banks, are no longer sufficient, and while regulators are on one hand delaying the implementation of Basel III and its tougher capital rules, on the other they are tactically admitting that whatever "generous" capital buffer banks have on their books right now will not be sufficient when the next crisis strikes."

The proposal for the first time introduced GLACs, or bonds known as "gone concern loss absorption capacity", seen by regulators as essential to stopping the world's 29 biggest lenders from being "too big to fail."

Some of our thoughts at the time: "according to the G-20, instead of having to collapse liabilities to offset that scourge of the New abnormal, namely Non-Performing Loans, banks are hoping to lever up, pun intended, the current scramble for yield and instead beef if up their cash asset, even if it means increasing the liability side of the balance sheet by issuing more debt. Because really all the GLAC do is limit how the banks may use the proceeds from such bond issuance. Then again, these being banks, one can be certain that the moment the GLAC cash is wired in, the funds will be used to ramp risk instead of sitting in a drawer somewhere, awaiting rainy days. Because nobody in a bank is paid for avoiding a crisis, and everyone is paid to generate a return even if it means making the systemic bubble even bigger."
And our summary:
in lieu of being able to actually generate and retain funds from operations, banks will once again scramble to raise epic amounts of debt, only this time, the proceeds will be retained "pinky swear" as a capital buffer, i.e., cash on the books. Cash which nobody makes a single dime in bonus on anywhere in the bank's org chart. Would anyone wish to wager how long before the trillions in GLACs are "mysteriously" found to have funded shanty town developments in Shanghai, to buy the S&P500 at the all time high, and naturally, the purchase of a golden commode or two in various US banks? How could this possibly fail...

And the absolutely brilliant punchline: who do these regulators and "leaders" think will be the purchasers of said debt? Why other systemically important, TBTF banks of course! Which means that, in the by now quite familiar "daisy-chaining" of counterparties and collateral, once one bank fails, its exposure via collateral, repo and certainly, funding of other bank balance sheets, everything will promptly freeze as risk reprices, a la Lehman bonds.
Fast forward to today when, focusing solely on the US, we learned that as part of the domestic "macroprudential" effort to ensure firms don't run out of cash in a crisis, the so-called Liquidity Coverage Ratio, US regulators said banks likely will have to raise an additional $100 billion to satisfy the new requirement, the WSJ reported.

The disclosure is part of the final draft of the so-called Liquidity Coverage Ratio, released by the Fed earlier today, and which was promptly passed on a 5-0 vote Wednesday that will subject big U.S. banks for the first time to so-called "liquidity" requirements. The Federal Deposit Insurance Corp. and the Treasury Department's Office of the Comptroller of the Currency adopted the rules later in the day.

According to the WSJ, the thrust of the proposal remains unchanged: Banks must now maintain enough safe assets to equal their net cash outflows over about a month.
Some of the details: "The 15 largest banks - those with more than $250 billion in assets - will have to hold enough cash, government bonds and other high-quality assets to fund operations for 30 days during a time of market stress. Smaller banks - those with more than $50 billion but less than $250 billion in assets - will have to keep enough to cover 21 days. Banks with less than $50 billion in assets and nonbank financial firms deemed by regulators as posing a potential threat to the system will not be subject to the requirements."
And some more:
Under the final version of the rule, U.S. banks with between $50 billion and $250 billion in assets will be able to calculate their liquidity positions on a monthly basis, rather than every day as proposed in the rule's first draft last fall. Those banks also won't have to start meeting the rule until January 1, 2016, giving them an extra year to comply.

Banks with more than $250 billion in assets will have to comply starting this coming January but will have until July 2015 before they must calculate the liquidity ratio on a daily basis.

Staff at the Fed estimated that the rule under consideration Wednesday would require big U.S. banks to raise an additional $100 billion of high-quality liquid assets, for a total of about $2.5 trillion.

Fed officials didn't make changes in response to the industry's concerns about the rule's treatment of municipal debt securities, which weren't classified as safe "high-quality liquid assets" that could count toward a bank's compliance. But Fed Gov. Dan Tarullo said staff would reconsider that point in the future and "develop some criteria for determining which such bonds fall into this category and thus might be considered for inclusion" as a high-quality liquid asset.

The shortfall as illustrated visually by the WSJ:

On the surface, this is all great macroprudential news: forcing banks to hold even more "high quality collateral" is a great idea, to minimize the amount of money taxpayers will have to fork over when the system crashes once again as it certainly will thanks to the unprecedented Fed micromanaging interventions over the past6 years.
There are just three problems.
  • First, when it comes to high quality collateral, there just isn't enough, a complaint the TBAC made loud and clear in early 2013 and which served as the basis for our assessment that Tapering will have to take place at least until such time as the US once again is forced to plug massive deficit funding holes, and thus the Fed can monetize copious amounts of debt once more.
  • Second, when one considers that the last time the financial system imploded it took not the paltry $700 billion TARP widely trumpeted as the "total" bailout cost, but closer to $14.4 trillion to keep the system from collapsing. As such, $100 billion - if and when the banks' funding mechanisms lock up again in the absence of a perpetual Fed backstop - is nothing but pocket change, even if added to an existing pool of some $2.5 trillion in "high-quality liquid" assets. Furthermore, when the system is locked up in a funding spasm, the last thing any counterparty will bother with is purchasing liquid securities from insolvent competitors at par or even 50 cents on the dollar. In fact, due to the systemic interconnectedness, the only possible buyer of these liquid assets will once again be... you guessed it... the Fed.
  • Third, and this is where this whole "macroprudential" scheme crashes under the weight of its own illogic, is when one considers that the source of the funding of any one bank's debt issuance proceeds, are other banks and financial intermediaries, all part of the same group of chain-linked counterparties, which hold on their shoulders over $200 trillion in notional derivatives, and where even one collateral chain breach means net becomes gross and the derivative exposure collapes into the singularity of the next bailout. Basically stated, banks X will be selling debt to bank Y in exchange for cash, thus boosting bank X' capital line item, while depleting bank Y's. And when the moment comes to rescue the liquidity depleted bank Y, what then?
In other words, not only is this latest window dressing too little to make a dent, or that there simply isn't enough of the high quality, liquid collateral needed to prefund a disaster fund, but at the end of the day, all that is happening is a circular pickpocketing where liquidity is simply rotated in a circle without any exogenous funds entering or leaving the banking sector. And as everyone knows, it isn't any one banks that is insolvent: it is the entire banking sector in total, confirmed quickly when one recalls that Hank Paulson "forced" all the banks to accept TARP funding to restore confidence in the US banking system: not a piecemeal bailout.

Which is why we appreciate both the attempt to pull the wool in front of everyone's eyes, and the humor behind it - the sad truth is that all of the above is not only meaningless, but it will likely further concentrate collateral and liquidity shortfalls away into the weakest banks whose failure will just make the TBTFs even bigger and even more systematically important.

What is worst of all, is that this example clearly indicates that when it comes to macroprudential policy, all the Fed really has, is an attempt to reallocate liabilities among the banking sector, in the process further obfuscation each bank's total exposure. As to the most important issue, collateral chains and counterparty exposure should the "weakest link" in said chain fall, the Fed's weapons are the same two it had during the last crisis: a printer and a prayer.

Everything else is still nothing but smoke and mirrors.