Only mass default will end the world's addiction to debt ... As global debt rises off the scale, creditors stand to take a huge hit in a threatened tsunami of defaults. – UK Telegraph
Dominant Social Theme: This will end badly as it has to.
Free-Market Analysis: This is another one of those hopeless articles that the mainstream media specializes in. There's nothing about it that provides any action points. You can understand what is going to happen but you can't do anything about it.
This is a specialty of the so-called sophisticated business media – of the mainstream kind. They'll give you a better sense of reality but they won't provide you any solutions.
Read the entire article

DAILY BUSINESS REPORT - Financial Updates, International Markets and Business News
March 13, 2015


March 12, 2015
China's Latest Spinning Plate: 10 Trillion In Local Government Debt
Over the past week, we’ve noted (twice) that Chinese QE is now practically inevitable. We learned recently that corporations’ FX deposits rose by some $45 billion in January which, remarkably, represents nearly half of the entire increase logged in 2014. This points to capital flight, as both companies and individuals are increasingly reluctant to hold the yuan in the face of slowing economic growth and the growing perception that devaluation is imminent. We also pointed out that despite the PBoC’s alleged interventions (evidence of which can be found in the data on the change in FI’s position for FX purchases), the yuan is still overvalued on a REER basis, meaning, to quote Barclays, “amid slowing inflation and rising outflows, the costs of limiting CNY weakness are growing – including the unintended effect of placing more stress on CNY market liquidity and interest rates, rendering liquidity easing efforts less effective.” China then, finds itself in a rather precarious position:
Against this backdrop, we got even more evidence today that the Chinese economic slowdown may be accelerating as industrial production, retail sales, and FAI all came in light of expectations prompting us to ask (again), “just how much longer do we have to wait until the inevitable moment when the last marginal central bank joins the global currency war and starts "printing money" on its own, finally pushing the world over to the next escalation level in the "[insert noun] wars" chain?”
To be sure, the Chinese Ministry of Finance isn’t too keen on “groundless” QE rumors and had the following to say overnight on the subject:

It seems as though one way to address the issue would be for the PBoC to simply purchase a portion of the local debt pile and we wonder if indeed this will ultimately be the form that QE will take in China. Here’s UBS with more:

We’ll leave you with what we said last week regarding the QE end game:
Ultimately, this led us to conclude that “the flowchart for what is in store for the world for the next 12-24 months [looks like this]: an ongoing deterioration in Chinese economic conditions, coupled with a weaker, but not weak enough, currency, before the PBOC first go to ZIRP, and then engages in outright QE".Excessive devaluation at a time when corporates are increasingly choosing to hold their export profits in currencies other than the yuan may hasten capital outflows. The irony of course is that failing to act aggressively to arrest REER appreciation risks cutting into those very same profits or, as we put it previously, “devalue too much, and the capital outflows will accelerate, not devalue enough, and the mercantilist economy gets it.”
Against this backdrop, we got even more evidence today that the Chinese economic slowdown may be accelerating as industrial production, retail sales, and FAI all came in light of expectations prompting us to ask (again), “just how much longer do we have to wait until the inevitable moment when the last marginal central bank joins the global currency war and starts "printing money" on its own, finally pushing the world over to the next escalation level in the "[insert noun] wars" chain?”
To be sure, the Chinese Ministry of Finance isn’t too keen on “groundless” QE rumors and had the following to say overnight on the subject:
- MOF'S ZHU GUANGYAO SAYS TALKS OF CHINA `QE' GROUNDLESS
- CHINA MOF OFFICIAL SAYS NO SUCH THING AS CHINA QE: SEC. JOURNAL
While this raises a number of questions (including whether creditors will be railroaded into participating and thus forced to accept much lower rates of return), the most important thing to note here is that the swaps account for but a small percentage of total local government debt, which the following chart shows:To begin with, local governments will be allowed to swap 1 trillion yuan ($160 billion) of their existing high-interest debts for lower-cost bonds. According to the Economic Observer, a credible local newspaper, this may just be the first tranche, with the finance ministry preparing to give local governments a 3 trillion yuan quota for refinancing. It is easy to imagine that such quotas will become a regular feature of China’s fiscal landscape over the next few years. As this chart shows, the combination of new debt issuance plus swaps will help cover what local governments owe this year, but will make only a small debt in their overall liabilities…
China’s local-government debt problem has always been twofold. First, there is the sheer amount of money they owe. That has doubled from less than 20% of GDP in 2007 to nearly 40% today. Second, there is the very peculiar and opaque structure of these liabilities. Because local governments can only borrow with the explicit permission of the finance ministry, which has been miserly in the past, they have been forced to use off-balance-sheet entities to raise funds. Those entities (commonly known as local government financing vehicles, or LGFVs) have borrowed from banks and shadow banks alike. As a result, the size of their debts is unclear, but it is certain that the cost of their debts is much higher than would have been the case had they issued bonds in the first place.
It seems as though one way to address the issue would be for the PBoC to simply purchase a portion of the local debt pile and we wonder if indeed this will ultimately be the form that QE will take in China. Here’s UBS with more:
It looks as though our prediction of outright debt monetization in China may be proven correct sooner than even we thought thanks to the trillions in loans the Chinese shadow banking complex has made to the country’s local governments who desperately need some manner of relief lest the 500bps over treasurys they’re paying should end up swallowing them all whole. We also wonder what’s next for Chinese stocks in the event “real” QE is introduced given that QE-lite (PSL) resulted in the following:Chinese domestic media citing "sources" saying that the authorities are considering a Chinese "QE" with the central bank funding the purchase of RMB 10 trillion in local government debt. In fact, the "sources" seem to be some brokerage research reports speculating ways of addressing the stock of local government debt, following the MOF announcement that local governments have been given a RMB 1 trillion quota to issue bonds to replace other forms of local debt.
The current central bank law in China prohibits direct monetization of government deficit. As we have written in "China unveils local government debt solutions" last October following the government's announcement, China is likely to swap existing debt stock with bonds that have longer maturity and lower yields. Further, we wrote that such replacement bonds could mount to RMB 1 trillion, which is in line with MOF announcement over the past weekend. In addition, we think the government will consider allowing private placement of local bonds or similar means to directly swap bank loans into local government bonds (without changing debtor or creditor), which would allow for much larger debt restructuring, helping to lower local government debt service payment, and at the same time improve banks' liquidity and capital position.
We’ll leave you with what we said last week regarding the QE end game:
SourceAnd once China, that final quasi-Western nation, proceeds to engage in outright monetization of its debt, then and only then will the terminal phase of the global currency wars start: a phase which will, because global economic growth and that all important lifeblood of a globalized economy - trade - at that point will be zero if not negative, will see an unprecedented crescendo of money printing by absolutely everyone, before coordinated devaluations mutate into uncoordinated, and when central bank actions morph from "all for one" to "each man for himself."
At that moment, what had been merely currency "war" will finally transform into a shooting one.
March 11, 2015
Next Mega-Bailout On Deck: White House Studying "New Bankruptcy Options" For Student-Loan Borrowers
A quick reminder of what the biggest debt bubble currently facing America's population is.

Why is this a problem? Because as the TBAC revealed a few months back, the default risk from the $1 trillions in student loans is several orders of magnitude above the 9% student loans which the Fed has revealed as currently "in default", as one has to add those 12% of loans in deferment and 11% in forbearance to the entire risk pool. In short: a third of all student loans are likely to end up unrepaid!
 And, the punchline: according to the TBAC's worst case scenario of the future of student debt, this gargantuan load will triple over the next decade, to as much as $3.3 trillion by 2024.
 This means that up to $1 trillion, and likely more, in household debt will go "bad" over the next decade. The problem: student debt is not dischargeable in a personal bankruptcy.
That is about to change.
It appears that just as the administration is finally figuring out what HFT is, it also decided to take a look at the charts above and has made a decision: the next bailout is about to be unveiled, and it will involve a "streamlined" bankruptcy law allowing students to discharge their student debt.
Moments ago this hit the wires via Dow Jones:

And since there is no such thing as a free lunch, it will be the US taxpayer who will as usual end up footing the bill. Expect college fees to go vertical once deans and administrators understand that they can charge anything and the taxpayer will end up footing the bill.
* * *
One can read the Fact Seet on the "Student Aid Bill of Rights: Taking Action to Ensure Strong Consumer Protections for Student Loan Borrowers" below:
Source
Why is this a problem? Because as the TBAC revealed a few months back, the default risk from the $1 trillions in student loans is several orders of magnitude above the 9% student loans which the Fed has revealed as currently "in default", as one has to add those 12% of loans in deferment and 11% in forbearance to the entire risk pool. In short: a third of all student loans are likely to end up unrepaid!
That is about to change.
It appears that just as the administration is finally figuring out what HFT is, it also decided to take a look at the charts above and has made a decision: the next bailout is about to be unveiled, and it will involve a "streamlined" bankruptcy law allowing students to discharge their student debt.
Moments ago this hit the wires via Dow Jones:
- WHITE HOUSE STUDYING NEW BANKRUPTCY OPTIONS FOR STUDENT-LOAN BORROWERS
- CURRENT U.S. LAW LARGELY PROHIBITS FEDERAL, PRIVATE LOANS FROM BEING DISCHARGED IN BANKRUPTCY
Which can only mean one thing: the appointment of a Student Loan Czar is imminent, as it the "discharge" of tens if not hundreds of billions in debt, which would never be repaid in any case.President Barack Obama is slated to speak to students at Georgia Tech on Tuesday about how he wants to make the process of repaying student loans easier to understand and manage. Obama will sign a student aid bill of rights and will speak about an assortment of policy tweaks and projects to try to make it easier to help people with student loans pay back their debt.
"It's our responsibility to make sure that the 40 million Americans with student loans are aware of resources to manage their debt, and that we are doing everything we can to be responsive to their needs," said Ted Mitchell, undersecretary of education, on a conference call with reporters.
More than 70 percent of U.S. students who graduate with a bachelor's degree leave with debt, which averages $28,400.
The White House said it will require clearer disclosures from companies to make sure borrowers understand who is servicing their loan and how to set monthly payments and change repayment plans.
"Repayment rates improve when servicers work well and work directly with borrowers, helping them understand the terms of their loans," said Sarah Bloom Raskin, deputy secretary of the Treasury Department, on the conference call.
Obama will direct his Education Department to create a system by July 1, 2016 to better oversee and address complaints from borrowers about lenders, servicers and collection agencies, the White House said.
His administration will also study whether it needs to propose changes to laws or regulations to create stronger consumer protections, the White House said.
And since there is no such thing as a free lunch, it will be the US taxpayer who will as usual end up footing the bill. Expect college fees to go vertical once deans and administrators understand that they can charge anything and the taxpayer will end up footing the bill.
* * *
One can read the Fact Seet on the "Student Aid Bill of Rights: Taking Action to Ensure Strong Consumer Protections for Student Loan Borrowers" below:
The full fact sheet here.Higher education continues to be the single most important investment students can make in their own futures. Five years ago this month, President Obama signed student loan reform into law, redirecting tens of billions of dollars in bank subsidies into student aid. His historic investments in college affordability include increasing the maximum Pell Grant by $1,000, creating the American Opportunity Tax Credit worth up to $10,000 over four years of college, and letting borrowers cap their student loan payments at 10 percent of income. He has also promoted innovation and competition to help colleges reduce costs and improve quality and completion, including a First in the World fund. While these investments have helped millions of students afford college, student loans continue to grow.
That is why, today, President Obama will underscore his vision for an affordable, quality education for all Americans in a Student Aid Bill of Rights. As part of this vision, the President will sign a Presidential Memorandum directing the Department of Education and other federal agencies to work across the federal government to do more to help borrowers afford their monthly loan payments including: (1) a state-of-the-art complaint system to ensure quality service and accountability for the Department of Education, its contractors, and colleges, (2) a series of steps to help students responsibly repay their loans including help setting affordable monthly payments, and (3) new steps to analyze student debt trends and recommend legislative and regulatory changes. In addition, the Administration is releasing state by state data that shows the outstanding federal student loan balance and total number of federal student loan borrowers who stand to benefit from these actions.
A Student Aid Bill of Rights
Today’s Actions to Promote Affordable Loan Payments
- Every student deserves access to a quality, affordable education at a college that’s cutting costs and increasing learning.
- Every student should be able to access the resources needed to pay for college.
- Every borrower has the right to an affordable repayment plan.
- And every borrower has the right to quality customer service, reliable information, and fair treatment, even if they struggle to repay their loans.
Americans are increasingly reliant on student loans to help pay for college. Today, more than 70 percent of those earning a bachelor’s degree graduate with debt, which averages $28,400 at public and non-profit colleges. Today’s actions will help borrowers responsibly manage their debt, improve federal student loan servicing, and protect taxpayers’ investments in the student aid program:
Help Borrowers Afford Their Monthly Payments: The President will announce a series of steps to improve customer services and help borrowers repay their direct student loans, which are made with federal capital and administered by the Department of Education through performance-based contracts. High-quality, borrower-focused servicing helps more borrowers successfully repay their federal student loans. Building on the stronger performance incentives put in place last year, the Department will now raise the bar by:
In addition, new requirements may be appropriate for private and federally guaranteed student loans so that all of the more than 40 million Americans with student loans have additional basic rights and protections. The President is directing his Cabinet and White House advisers, working with the Consumer Financial Protection Bureau, to study whether consumer protections recently applied to mortgages and credit cards, such as notice and grace periods after loans are transferred among lenders and a requirement that lenders confirm balances to allow borrowers to pay off the loan, should also be afforded to student loan borrowers and improve the quality of servicing for all types of student loans. The agencies will develop recommendations for regulatory and legislative changes for all student loan borrowers, including possible changes to the treatment of loans in bankruptcy proceedings and when they were borrowed under fraudulent circumstances.
- Requiring enhanced disclosures and stronger consumer protections throughout the repayment process, including when federal student loans are transferred from one servicer to another, when borrowers fall behind in their payments, and when borrowers begin but do not complete applications to change repayment plans. These steps will better protect borrowers from falling behind in their payments and ensure consistency across loan servicers.
- Ensuring that its contractors apply prepayments first to loans with the highest interest rates unless the borrower requests a different allocation.
- Establishing a centralized point of access for all federal student loan borrowers in repayment to access account and payment processing information for all Federal student loan servicing contractors.
- Ensuring fair treatment for struggling and distressed borrowers by raising standards for student loan debt collectors to ensure that they charge borrowers reasonable fees and help them return to good standing; clarifying the rights of Federal student loan borrowers in bankruptcy; working with the Department of Treasury to simplify the process to verify income and keep borrowers enrolled in income-driven repayment plans; and working with the Social Security Administration to ensure that disability insurance recipients who can discharge their student loans are not instead seeing their disability payments garnished to repay defaulted loans.
Source
March 10, 2015
7 Signs That A Stock Market Peak Is Happening Right Now
Is this the end of the last great run for the U.S. stock market? Are we witnessing classic “peaking behavior” that is similar to what occurred just before other major stock market crashes? Throughout 2014 and for the early stages of 2015, stocks have been on quite a tear. Even though the overall U.S. economy continues to be deeply troubled, we have seen the Dow, the S&P 500 and the Nasdaq set record after record. But no bull market lasts forever – particularly one that has no relation to economic reality whatsoever. This false bubble of financial prosperity has been enjoyable, and even I wish that it could last much longer. But there comes a time when we all must face reality, and the cold, hard facts are telling us that this party is about to end. The following are 7 signs that a stock market peak is happening right now…
#1 Just before a stock market crash, price/earnings ratios tend to spike, and that is precisely what we are witnessing. The following commentary and chart come from Lance Roberts…
#2 The average bull market lasts for approximately 3.8 years. The current bull market has already lasted for six years.
#3 The median total gain during a bull market is 101.5 percent. For this bull market, it has been 213 percent.
#4 Usually before a stock market crash we see a divergence between the relative strength index and the stock market itself. This happened prior to the bursting of the dotcom bubble, it happened prior to the crash of 2008, and it is happening again right now…
#6 As I have discussed previously, we usually witness a spike in 10 year Treasury yields just about the time that the stock market is peaking right before a crash.
Well, according to Business Insider, we just saw the largest 5 week rate rally in two decades…
Well, the truth is that nobody knows for certain.
It could happen this week, or it could be six months from now.
In fact, a whole lot of people are starting to point to the second half of 2015 as a danger zone. For example, just consider the words of David Morgan…
But without a doubt, lots of economic warning signs are starting to pop up.
One that is particularly troubling is the decline in new orders for consumer goods. This is something that Charles Hugh-Smith pointed out in one of his recent articles…
To me, it very much appears that time is running out for this bubble of false prosperity that we have been living in.
But what do you think? Please feel free to contribute to the discussion by posting a comment below…
Source
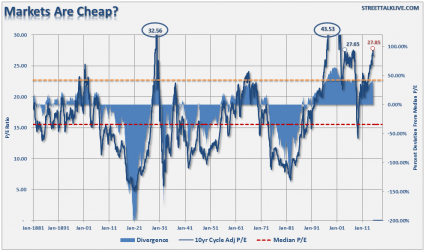
#1 Just before a stock market crash, price/earnings ratios tend to spike, and that is precisely what we are witnessing. The following commentary and chart come from Lance Roberts…
The chart below shows Dr. Robert Shiller’s cyclically adjusted P/E ratio. The problem is that current valuations only appear cheap when compared to the peak in 2000. In order to put valuations into perspective, I have capped P/E’s at 30x trailing earnings. The dashed orange line measures 23x earnings which has been the level where secular bull markets have previously ended. I have noted the peak valuations in periods that have exceeded that 30x earnings.
At 27.85x current earning the markets are currently at valuation levels where previous bull markets have ended rather than continued. Furthermore, the markets have exceeded the pre-financial crisis peak of 27.65x earnings. If earnings continue to deteriorate, market valuations could rise rapidly even if prices remain stagnant.
#2 The average bull market lasts for approximately 3.8 years. The current bull market has already lasted for six years.
#3 The median total gain during a bull market is 101.5 percent. For this bull market, it has been 213 percent.
#4 Usually before a stock market crash we see a divergence between the relative strength index and the stock market itself. This happened prior to the bursting of the dotcom bubble, it happened prior to the crash of 2008, and it is happening again right now…
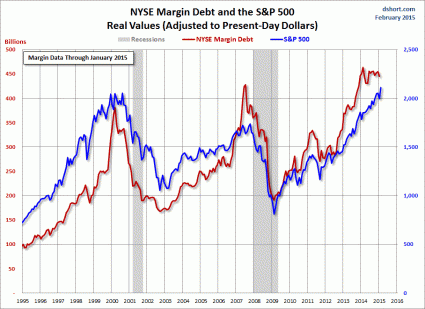
The first technical warning sign that we should heed is marked by a significant divergence between the relative strength index (RSI) and the market itself. This is noted by a declining pattern of lower highs in the RSI as stocks continue to make higher highs, a sign that the market is “topping out”. In the late ‘90s this divergence persisted for many years as the tech bubble reached epic valuation levels. In 2007 this divergence lasted over a much shorter period (6 months) before the market finally peaked and succumbed to massive selling. With last month’s strong rally to new records, we now have a confirmed divergence between the long-term relative strength index and the market’s price action.#5 In the past, peaks in margin debt have been very closely associated with stock market peaks. The following chart comes from Doug Short, and I included it in a previous article…
#6 As I have discussed previously, we usually witness a spike in 10 year Treasury yields just about the time that the stock market is peaking right before a crash.
Well, according to Business Insider, we just saw the largest 5 week rate rally in two decades…
Lots of guys and gals went home this past weekend thinking about the implications of the recent rise in the 10-year Treasury bond’s yield.#7 A lot of momentum indicators seem to be telling us that we are rapidly approaching a turning point for stocks. For example, James Stack, the editor of InvesTech Research, says that the Coppock Guide is warning us of “an impending bear market on the not-too-distant horizon”…
Chris Kimble notes it was the biggest 5-week rate rally in twenty years!
A momentum indicator dubbed the Coppock Guide, which serves as “a barometer of the market’s emotional state,” has also peaked, Stack says. The indicator, which, “tracks the ebb and flow of equity markets from one psychological extreme to another,” is also flashing a warning flag.
The Coppock Guide’s chart pattern is flashing a “double top,” which suggests that “psychological excesses are present” and that “secondary momentum has peaked” in this bull market, according to Stack.
“All of this is just another reason for concern about an impending bear market on the not-too-distant horizon,” Stack writes.So if we are to see a stock market crash soon, when will it happen?
Well, the truth is that nobody knows for certain.
It could happen this week, or it could be six months from now.
In fact, a whole lot of people are starting to point to the second half of 2015 as a danger zone. For example, just consider the words of David Morgan…
“Momentum is one indicator and the money supply. Also, when I made my forecast, there is a big seasonality, and part of it is strict analytical detail and part of it is being in this market for 40 years. I got a pretty good idea of what is going on out there and the feedback I get. . . . I’m in Europe, I’m in Asia, I’m in South America, I’m in Mexico, I’m in Canada; and so, I get a global feel, if you will, for what people are really thinking and really dealing with. It’s like a barometer reading, and I feel there are more and more tensions all the time and less and less solutions. It’s a fundamental take on how fed up people are on a global basis. Based on that, it seems to me as I said in the January issue of the Morgan Report, September is going to be the point where people have had it.”Time will tell if Morgan was right.
But without a doubt, lots of economic warning signs are starting to pop up.
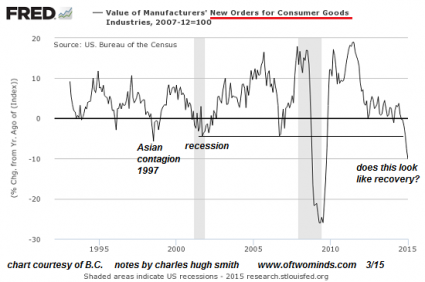
One that is particularly troubling is the decline in new orders for consumer goods. This is something that Charles Hugh-Smith pointed out in one of his recent articles…
The financial news is astonishingly rosy: record trade surpluses in China, positive surprises in Europe, the best run of new jobs added to the U.S. economy since the go-go 1990s, and the gift that keeps on giving to consumers everywhere, low oil prices.
So if everything is so fantastic, why are new orders cratering? New orders are a snapshot of future demand, as opposed to current retail sales or orders that have been delivered.Posted below is a chart that he included with his recent article. As you can see, the only time things have been worse in recent decades was during the depths of the last financial crisis…
To me, it very much appears that time is running out for this bubble of false prosperity that we have been living in.
But what do you think? Please feel free to contribute to the discussion by posting a comment below…
Source
March 9, 2015
Don’t Be Fooled by the Federal Reserve’s Anti-Audit Propaganda
In recent weeks, the Federal Reserve and its apologists in Congress and the media have launched numerous attacks on the Audit the Fed legislation. These attacks amount to nothing more than distortions about the effects and intent of the audit bill.
Fed apologists continue to claim that the Audit the Fed bill will somehow limit the Federal Reserve's independence. Yet neither Federal Reserve Chair Janet Yellen nor any other opponent of the audit bill has ever been able to identify any provision of the bill giving Congress power to dictate monetary policy. The only way this argument makes sense is if the simple act of increasing transparency somehow infringes on the Fed's independence.
This argument is also flawed since the Federal Reserve has never been independent from political pressure. As economists Daniel Smith and Peter Boettke put it in their paper "An Episodic History of Modern Fed Independence," the Federal Reserve "regularly accommodates debt, succumbs to political pressures, and follows bureaucratic tendencies, compromising the Fed's operational independence."
The most infamous example of a Federal Reserve chair bowing to political pressure is the way Federal Reserve Chairman Arthur Burns tailored monetary policy to accommodate President Richard Nixon's demands for low interest rates. Nixon and Burns were even recorded mocking the idea of Federal Reserve independence.
Nixon is not the only president to pressure a Federal Reserve chair to tailor monetary policy to the president's political needs. In the fifties, President Dwight Eisenhower pressured Fed Chairman William Martin to either resign or increase the money supply. Martin eventually gave in to Ike's wishes for cheap money. During the nineties, Alan Greenspan was accused by many political and financial experts – including then-Federal Reserve Board Member Alan Blinder – of tailoring Federal Reserve policies to help President Bill Clinton.
Some Federal Reserve apologists make the contradictory claim that the audit bill is not only dangerous, but it is also unnecessary since the Fed is already audited. It is true that the Federal Reserve is subject to some limited financial audits, but these audits only reveal the amount of assets on the Fed's balance sheets. The Audit the Fed bill will reveal what was purchased, when it was acquired, and why it was acquired.
Perhaps the real reason the Federal Reserve fears a full audit can be revealed by examining the one-time audit of the Federal Reserve's response to the financial crisis authorized by the Dodd-Frank law. This audit found that between 2007 and 2010 the Federal Reserve committed over $16 trillion – more than four times the annual budget of the United States – to foreign central banks and politically influential private companies. Can anyone doubt a full audit would show similar instances of the Fed acting to benefit the political and economic elites?
Some fed apologists are claiming that the audit bill is part of a conspiracy to end the Fed. As the author of a book called End the Fed, I find it laughable to suggest that I, and other audit supporters, are hiding our true agenda. Besides, how could an audit advance efforts to end the Fed unless the audit would prove that the American people would be better off without the Fed? And don't the people have a right to know if they are being harmed by the current monetary system?
For over a century, the Federal Reserve has operated in secrecy, to the benefit of the elites and the detriment of the people. It is time to finally bring transparency to monetary policy by auditing the Federal Reserve.
Source
Fed apologists continue to claim that the Audit the Fed bill will somehow limit the Federal Reserve's independence. Yet neither Federal Reserve Chair Janet Yellen nor any other opponent of the audit bill has ever been able to identify any provision of the bill giving Congress power to dictate monetary policy. The only way this argument makes sense is if the simple act of increasing transparency somehow infringes on the Fed's independence.
This argument is also flawed since the Federal Reserve has never been independent from political pressure. As economists Daniel Smith and Peter Boettke put it in their paper "An Episodic History of Modern Fed Independence," the Federal Reserve "regularly accommodates debt, succumbs to political pressures, and follows bureaucratic tendencies, compromising the Fed's operational independence."
The most infamous example of a Federal Reserve chair bowing to political pressure is the way Federal Reserve Chairman Arthur Burns tailored monetary policy to accommodate President Richard Nixon's demands for low interest rates. Nixon and Burns were even recorded mocking the idea of Federal Reserve independence.
Nixon is not the only president to pressure a Federal Reserve chair to tailor monetary policy to the president's political needs. In the fifties, President Dwight Eisenhower pressured Fed Chairman William Martin to either resign or increase the money supply. Martin eventually gave in to Ike's wishes for cheap money. During the nineties, Alan Greenspan was accused by many political and financial experts – including then-Federal Reserve Board Member Alan Blinder – of tailoring Federal Reserve policies to help President Bill Clinton.
Some Federal Reserve apologists make the contradictory claim that the audit bill is not only dangerous, but it is also unnecessary since the Fed is already audited. It is true that the Federal Reserve is subject to some limited financial audits, but these audits only reveal the amount of assets on the Fed's balance sheets. The Audit the Fed bill will reveal what was purchased, when it was acquired, and why it was acquired.
Perhaps the real reason the Federal Reserve fears a full audit can be revealed by examining the one-time audit of the Federal Reserve's response to the financial crisis authorized by the Dodd-Frank law. This audit found that between 2007 and 2010 the Federal Reserve committed over $16 trillion – more than four times the annual budget of the United States – to foreign central banks and politically influential private companies. Can anyone doubt a full audit would show similar instances of the Fed acting to benefit the political and economic elites?
Some fed apologists are claiming that the audit bill is part of a conspiracy to end the Fed. As the author of a book called End the Fed, I find it laughable to suggest that I, and other audit supporters, are hiding our true agenda. Besides, how could an audit advance efforts to end the Fed unless the audit would prove that the American people would be better off without the Fed? And don't the people have a right to know if they are being harmed by the current monetary system?
For over a century, the Federal Reserve has operated in secrecy, to the benefit of the elites and the detriment of the people. It is time to finally bring transparency to monetary policy by auditing the Federal Reserve.
Source
March 6, 2015
Unraveling The Mystery Of Oil And The Swiss Franc
I want to preface my article with a short excerpt from one of my favorite books,Antifragile, by Nassim Taleb:
Has the DNA of the global economy been gradually altered by endless injections of quantitative easing, morphing it into a freakish mutant? Are things that are not supposed to happen for centuries on end going to become common occurrences? The collapse of oil prices and jump in the Swiss franc have forced me to puzzle over these weighty questions. In isolation, these events and the direction of their moves did not worry me, but their magnitude, velocity and proximity to each other sent me on an intellectual quest.
Let’s start with oil. Supply has been increasing due to growth in shale oil production in the U.S., and that increase along with a stronger dollar drove oil prices lower (since oil is priced in dollars). Additionally, demand for oil has weakened in the developed markets as vehicles have become more fuel-efficient. However, none of these things are new. You can also blame the fall in oil prices on OPEC and its unwillingness to lower production, but what is now an obvious decline was not obvious six months ago. Oil prices have sunk more than 50 percent in less than five months, and this happened not during a financial crisis but in a (supposedly) stable global economy where most economies are growing.
Now let’s place these events in the context of the current environment. Ultralow global interest rates have pushed all market participants into riskier assets. For instance, investors who in the past could tolerate only the risk of high-quality, short-duration Treasury bonds are now gulping long-duration junk bonds as if they were default-free Treasuries. In addition, low interest rates are also pushing investors into using more leverage. This point is now more important than ever. Volatility and leverage are not friends. Crucially, we don’t know where all the leverage is buried and will only find out after the fact.
So far, corporate defaults are de minimis — but that won’t last forever. In other words, investors to date have only reaped the benefits of owning riskier assets but have not suffered from the “risky” part of that theme. But suffering will come, unless you believe that QE injections have miraculously modified the laws of financial gravity so that by taking more risk you simply get ever-higher returns.
If you are waiting for Wall Street economists or strategists to warn you about impending risks, don’t hold your breath — none of them were forecasting $50 oil prices a year ago. Oil production and the global economy as a whole did not fundamentally change in 2014, but oil now costs half as much as it did a year ago. The lesson we should learn from the oil price decline is that risks can develop fast in places we don’t expect them, and they may only be obvious in hindsight.
Now let’s talk about the Swiss franc, which jumped 16 percent in one day when the Swiss National Bank decided it couldn’t afford to go on losing billions of francs month after month, desperately trying to keep its currency down in relation to the euro and dollar. Instead, it opted to pass the burden of losses on to investors looking for a safe harbor in the Swiss franc, by imposing negative interest rates on deposits.
Let’s expand on this fact for a second: Today, if you buy bonds issued by the Swiss government, you’ll pay interest for the privilege of holding your hard-earned savings in the Swiss currency. Normally, governments pay you — the investor — for your consideration in investing in their bonds. But for the Swiss these are not normal times.
I cannot recall when the currency of a developed country — we’re not talking about a banana republic here; we’re talking about Switzerland — moved 16 percent in one day. (Unlike stocks, a 1 or 2 percent intraday move in a currency is considered to be a big shift.) By the way, negative interest rates are not part of the normal economics curriculum either.
Here is the lesson from this:
We are dialing down on risk even further in our stock selection; and despite the euphoria in the stock market, we are raising the bar for stocks in our portfolio — we are going medieval on quality and the margin of safety. This will cause our cash balances to increase. Cash has not been the investor’s friend — it is never a friend in a rising market. But oil prices and the Swiss franc have reminded us again that risk can spread quickly, and when you need cash it may already be too late to raise it. We are giving up some returns today for the ability to buy attractive stocks at lower prices in the near future.
Source
Our global economy and thus stock markets have experienced manufactured (not true) stability, and this is what I am puzzling about in the following article that I wrote for Institutional Investor.A turkey is fed for a thousand days by a butcher; every day confirms to its staff of analysts that butchers love turkeys “with increased statistical confidence.” The butcher will keep feeding the turkey until a few days before Thanksgiving. Then comes that day when it is really not a very good idea to be a turkey. So with the butcher surprising it, the turkey will have a revision of belief—right when its confidence in the statement that the butcher loves turkeys is maximal and “it is very quiet” and soothingly predictable in the life of the turkey.…The key here is that such a surprise will be a Black Swan event; but just for the turkey, not for the butcher….
“Not being a turkey” starts with figuring out the difference between true and manufactured stability.
(emphasis mine).
Has the DNA of the global economy been gradually altered by endless injections of quantitative easing, morphing it into a freakish mutant? Are things that are not supposed to happen for centuries on end going to become common occurrences? The collapse of oil prices and jump in the Swiss franc have forced me to puzzle over these weighty questions. In isolation, these events and the direction of their moves did not worry me, but their magnitude, velocity and proximity to each other sent me on an intellectual quest.
Let’s start with oil. Supply has been increasing due to growth in shale oil production in the U.S., and that increase along with a stronger dollar drove oil prices lower (since oil is priced in dollars). Additionally, demand for oil has weakened in the developed markets as vehicles have become more fuel-efficient. However, none of these things are new. You can also blame the fall in oil prices on OPEC and its unwillingness to lower production, but what is now an obvious decline was not obvious six months ago. Oil prices have sunk more than 50 percent in less than five months, and this happened not during a financial crisis but in a (supposedly) stable global economy where most economies are growing.
Now let’s place these events in the context of the current environment. Ultralow global interest rates have pushed all market participants into riskier assets. For instance, investors who in the past could tolerate only the risk of high-quality, short-duration Treasury bonds are now gulping long-duration junk bonds as if they were default-free Treasuries. In addition, low interest rates are also pushing investors into using more leverage. This point is now more important than ever. Volatility and leverage are not friends. Crucially, we don’t know where all the leverage is buried and will only find out after the fact.
So far, corporate defaults are de minimis — but that won’t last forever. In other words, investors to date have only reaped the benefits of owning riskier assets but have not suffered from the “risky” part of that theme. But suffering will come, unless you believe that QE injections have miraculously modified the laws of financial gravity so that by taking more risk you simply get ever-higher returns.
If you are waiting for Wall Street economists or strategists to warn you about impending risks, don’t hold your breath — none of them were forecasting $50 oil prices a year ago. Oil production and the global economy as a whole did not fundamentally change in 2014, but oil now costs half as much as it did a year ago. The lesson we should learn from the oil price decline is that risks can develop fast in places we don’t expect them, and they may only be obvious in hindsight.
Now let’s talk about the Swiss franc, which jumped 16 percent in one day when the Swiss National Bank decided it couldn’t afford to go on losing billions of francs month after month, desperately trying to keep its currency down in relation to the euro and dollar. Instead, it opted to pass the burden of losses on to investors looking for a safe harbor in the Swiss franc, by imposing negative interest rates on deposits.
Let’s expand on this fact for a second: Today, if you buy bonds issued by the Swiss government, you’ll pay interest for the privilege of holding your hard-earned savings in the Swiss currency. Normally, governments pay you — the investor — for your consideration in investing in their bonds. But for the Swiss these are not normal times.
I cannot recall when the currency of a developed country — we’re not talking about a banana republic here; we’re talking about Switzerland — moved 16 percent in one day. (Unlike stocks, a 1 or 2 percent intraday move in a currency is considered to be a big shift.) By the way, negative interest rates are not part of the normal economics curriculum either.
Here is the lesson from this:
Here’s another analogy: The arguments in favor of GMO crops are that they increase yields, decrease the need for pesticides and mitigate soil erosion. The argument against them is simple but more ambiguous: We don’t know the long-term consequences of growing and eating GMOs. It’s the same thing with QE, which is even less organic to the economy than GMOs are to the soil and the human body. We know the positives, but it is the hidden consequences, the things we don’t know, that scare me.We don’t know what the ultimate consequences of near-zero interest rates will be, but we are pretty sure their impact will be amplified by increased leverage in the system and the dangerous mismatch between risky assets and their holders. This will lead to increased volatility in places we don’t expect.
We are dialing down on risk even further in our stock selection; and despite the euphoria in the stock market, we are raising the bar for stocks in our portfolio — we are going medieval on quality and the margin of safety. This will cause our cash balances to increase. Cash has not been the investor’s friend — it is never a friend in a rising market. But oil prices and the Swiss franc have reminded us again that risk can spread quickly, and when you need cash it may already be too late to raise it. We are giving up some returns today for the ability to buy attractive stocks at lower prices in the near future.
Source
March 5, 2015
“Default Monday”: Oil & Gas Companies Face Their Creditors as the Fracking Bubble Bursts
Debt funded the fracking boom. Now oil and gas prices have collapsed, and so has the ability to service that debt. The oil bust of the 1980s took down 700 banks, including 9 of the 10 largest in Texas. But this time, it’s different. This time, bondholders are on the hook.
And these bonds – they’re called “junk bonds” for a reason – are already cracking. Busts start with small companies and proceed to larger ones. “Bankruptcy” and “restructuring” are the terms that wipe out stockholders and leave bondholders and other creditors to tussle over the scraps.
Early January, WBH Energy, a fracking outfit in Texas, kicked off the series by filing for bankruptcy protection. It listed assets and liabilities of $10 million to $50 million. Small fry.
A week later, GASFRAC filed for bankruptcy in Alberta, where it’s based, and in Texas – under Chapter 15 for cross-border bankruptcies. Not long ago, it was a highly touted IPO, whose “waterless fracking” technology would change a parched world. Instead of water, the system pumps liquid propane gel (similar to Napalm) into the ground; much of it can be recaptured, in theory.
Ironically, it went bankrupt for other reasons: operating losses, “reduced industry activity,” the inability to find a buyer that would have paid enough to bail out its creditors, and “limited access to capital markets.” The endless source of money without which fracking doesn’t work had dried up.
On February 17, Quicksilver Resources announced that it would not make a $13.6 million interest payment on its senior notes due in 2019. It invoked the possibility of filing for Chapter 11 bankruptcy to “restructure its capital structure.” Stockholders don’t have much to lose; the stock is already worthless. The question is what the creditors will get.
It has hired Houlihan Lokey Capital, Deloitte Transactions and Business Analytics, “and other advisors.” During its 30-day grace period before this turns into an outright default, it will haggle with its creditors over the “company’s options.”
On February 27, Hercules Offshore had its share-price target slashed to zero, from $4 a share, at Deutsche Bank, which finally downgraded the stock to “sell.” If you wait till Deutsche Bank tells you to sell, you’re ruined!
When I wrote about Hercules on October 15, HERO was trading at $1.47 a share, down 81% since July. Those who followed the hype to “buy the most hated stocks” that day lost another 44% by the time I wrote about it on January 16, when HERO was at $0.82 a share. Wednesday, shares closed at $0.60.
Deutsche Bank was right, if late. HERO is headed for zero (what a trip to have a stock symbol that rhymes with zero). It’s going to restructure its junk debt. Stockholders will end up holding the bag.
On Monday, due to “chronically low natural gas prices exacerbated by suddenly weaker crude oil prices,” Moody’s downgraded gas-driller Samson Resources, to Caa3, invoking “a high risk of default.”
It was the second time in two months that Moody’s downgraded the company. The tempo is picking up. Moody’s:
This is no longer small fry.
Also on Monday, oil-and-gas exploration and production company BPZ Resources announced that it would not pay $62 million in principal and interest on convertible notes that were due on March 1. It will use its grace period of 10 days on the principal and of 30 days on the interest to figure out how to approach the rest of its existence. It invoked Chapter 11 bankruptcy as one of the options.
If it fails to make the payments within the grace period, it would also automatically be in default of its 2017 convertible bonds, which would push the default to $229 million.
BPZ already tried to refinance the 2015 convertible notes in October and get some extra cash. Fracking devours prodigious amounts of cash. But there’d been no takers for the $150 million offering. Even bond fund managers, driven to sheer madness by the Fed’s policies, had lost their appetite. And its stock is worthless.
Also on Monday – it was “default Monday” or something – American Eagle Energy announced that it would not make a $9.8 million interest payment on $175 million in bonds due that day. It will use its 30-day grace period to hash out its future with its creditors. And it hired two additional advisory firms.
One thing we know already: after years in the desert, restructuring advisors are licking their chops.
The company has $13.6 million in negative working capital, only $25.9 million in cash, and its $60 million revolving credit line has been maxed out.
But here is the thing: the company sold these bonds last August! And this was supposed to be its first interest payment.
That’s what a real credit bubble looks like. In the Fed’s environment of near-zero yield on reasonable investments, bond fund managers are roving the land chasing whatever yield they can discern. And they’re holding their nose while they pick up this stuff to jam it into bond funds that other folks have in their retirement portfolio.
Not even a single interest payment!
Borrowed money fueled the fracking boom. The old money has been drilled into the ground. The new money is starting to dry up. Fracked wells, due to their horrendous decline rates, produce most of their oil and gas over the first two years. And if prices are low during that time, producers will never recuperate their investment in those wells, even if prices shoot up afterwards. And they’ll never be able to pay off the debt from the cash flow of those wells. A chilling scenario that creditors were blind to before, but are now increasingly forced to contemplate.
When the heck will the bloodletting stop? Read… The Fracking Bust Exacts its Pound of Flesh
Source
And these bonds – they’re called “junk bonds” for a reason – are already cracking. Busts start with small companies and proceed to larger ones. “Bankruptcy” and “restructuring” are the terms that wipe out stockholders and leave bondholders and other creditors to tussle over the scraps.
Early January, WBH Energy, a fracking outfit in Texas, kicked off the series by filing for bankruptcy protection. It listed assets and liabilities of $10 million to $50 million. Small fry.
A week later, GASFRAC filed for bankruptcy in Alberta, where it’s based, and in Texas – under Chapter 15 for cross-border bankruptcies. Not long ago, it was a highly touted IPO, whose “waterless fracking” technology would change a parched world. Instead of water, the system pumps liquid propane gel (similar to Napalm) into the ground; much of it can be recaptured, in theory.
Ironically, it went bankrupt for other reasons: operating losses, “reduced industry activity,” the inability to find a buyer that would have paid enough to bail out its creditors, and “limited access to capital markets.” The endless source of money without which fracking doesn’t work had dried up.
On February 17, Quicksilver Resources announced that it would not make a $13.6 million interest payment on its senior notes due in 2019. It invoked the possibility of filing for Chapter 11 bankruptcy to “restructure its capital structure.” Stockholders don’t have much to lose; the stock is already worthless. The question is what the creditors will get.
It has hired Houlihan Lokey Capital, Deloitte Transactions and Business Analytics, “and other advisors.” During its 30-day grace period before this turns into an outright default, it will haggle with its creditors over the “company’s options.”
On February 27, Hercules Offshore had its share-price target slashed to zero, from $4 a share, at Deutsche Bank, which finally downgraded the stock to “sell.” If you wait till Deutsche Bank tells you to sell, you’re ruined!
When I wrote about Hercules on October 15, HERO was trading at $1.47 a share, down 81% since July. Those who followed the hype to “buy the most hated stocks” that day lost another 44% by the time I wrote about it on January 16, when HERO was at $0.82 a share. Wednesday, shares closed at $0.60.
Deutsche Bank was right, if late. HERO is headed for zero (what a trip to have a stock symbol that rhymes with zero). It’s going to restructure its junk debt. Stockholders will end up holding the bag.
On Monday, due to “chronically low natural gas prices exacerbated by suddenly weaker crude oil prices,” Moody’s downgraded gas-driller Samson Resources, to Caa3, invoking “a high risk of default.”
It was the second time in two months that Moody’s downgraded the company. The tempo is picking up. Moody’s:
The company’s stressed liquidity position, delays in reaching agreements on potential asset sales and its retention of restructuring advisors increases the possibility that the company may pursue a debt restructuring that Moody’s would view as a default.Moody’s was late to the party. On February 26, it was leaked that Samson had hired restructuring advisors Kirkland & Ellis and Blackstone’s restructuring group to figure out how to deal with its $3.75 billion in debt. A group of private equity firms, led by KKR, had acquired Samson in 2011 for $7.2 billion. Since then, Samson has lost $3 billion. KKR has written down its equity investment to 5 cents on the dollar.
This is no longer small fry.
Also on Monday, oil-and-gas exploration and production company BPZ Resources announced that it would not pay $62 million in principal and interest on convertible notes that were due on March 1. It will use its grace period of 10 days on the principal and of 30 days on the interest to figure out how to approach the rest of its existence. It invoked Chapter 11 bankruptcy as one of the options.
If it fails to make the payments within the grace period, it would also automatically be in default of its 2017 convertible bonds, which would push the default to $229 million.
BPZ already tried to refinance the 2015 convertible notes in October and get some extra cash. Fracking devours prodigious amounts of cash. But there’d been no takers for the $150 million offering. Even bond fund managers, driven to sheer madness by the Fed’s policies, had lost their appetite. And its stock is worthless.
Also on Monday – it was “default Monday” or something – American Eagle Energy announced that it would not make a $9.8 million interest payment on $175 million in bonds due that day. It will use its 30-day grace period to hash out its future with its creditors. And it hired two additional advisory firms.
One thing we know already: after years in the desert, restructuring advisors are licking their chops.
The company has $13.6 million in negative working capital, only $25.9 million in cash, and its $60 million revolving credit line has been maxed out.
But here is the thing: the company sold these bonds last August! And this was supposed to be its first interest payment.
That’s what a real credit bubble looks like. In the Fed’s environment of near-zero yield on reasonable investments, bond fund managers are roving the land chasing whatever yield they can discern. And they’re holding their nose while they pick up this stuff to jam it into bond funds that other folks have in their retirement portfolio.
Not even a single interest payment!
Borrowed money fueled the fracking boom. The old money has been drilled into the ground. The new money is starting to dry up. Fracked wells, due to their horrendous decline rates, produce most of their oil and gas over the first two years. And if prices are low during that time, producers will never recuperate their investment in those wells, even if prices shoot up afterwards. And they’ll never be able to pay off the debt from the cash flow of those wells. A chilling scenario that creditors were blind to before, but are now increasingly forced to contemplate.
When the heck will the bloodletting stop? Read… The Fracking Bust Exacts its Pound of Flesh
Source
March 4, 2015
Could Oil Prices Plummet A Second Time?
Are oil prices heading for a double dip?
The surge in shale production has produced a temporary glut in supplies causing oil prices to experience a massive bust. After tanking to a low of $44 per barrel in January, falling rig counts and enormous reductions in exploration budgets have fueled speculation that the market will correct sometime later this year.
However, there is a possibility that the recent rise to $51 for WTI and $60 for Brent may only be temporary. In fact, several trends are conspiring to force prices down for a second time.
Drillers are consciously deciding to delay the completion of their wells, holding off in hopes that oil prices will rebound, according to E&E’s EnergyWire. The decision to put well completions on hold could provide a critical boost to the ultimate profitability of many projects. Higher oil prices in the months ahead will provide companies with more money for each barrel sold. But also, with the bulk of a given shale well’s lifetime production coming within the first year or two, it becomes all the more important to bring a well online when oil prices are favorable. With prices still depressed – WTI is hovering just above $50 per barrel – drillers are waiting for sunnier days.
Yet another reason to wait is the possibility that costs for well completions will decline. Oil and gas companies often contract out well completions to third parties, and those companies will face pressure to cut their fees in order to keep business. That works in favor of producers who put their projects on hold for the time being. Well completions can make up as much as three-quarters of the total project cost.
Several prominent shale drillers have confirmed they are undertaking such a wait-and-see strategy. EOG Resources, one of the biggest Texas shale drillers, announced its plans in late February to hold off on completions. Chesapeake Energy and Continental Resources have now followed suit.
“We’re intentionally holding production back in 2015, because we believe it’s the prudent thing to do,” Doug Lawler, Chesapeake’s CEO, said in a conference call. Chesapeake has said it may delay completing as many as 100 wells. EOG has 200 wells awaiting completion, a backlog that will intentionally rise to about 350 this year.
As the industry clears out that queue of wells awaiting completion, a rush of new supplies could come online, pushing WTI prices down once again.
Even with well completions being suspended, supplies continue to build. The latest EIA data shows that oil stocks in the United States climbed to 434 million barrels, the highest levels in storage in over 80 years. “My gut feeling is that the oil price could see a double bottom,” Jason Kenney, an analyst with Banco Santaander SA said in a Bloomberg interview. “We’ve got too much inventory.”
Bloomberg noted that Kenney has a good track record of predicting price swings in the past. Even though rig counts have declined significantly, output has so far proved resilient.
Finally, there is some evidence that the ability to move excess oil into storage may run into trouble if production does not decline. Storage tanks are starting to fill, raising the possibility that a glut could worsen. There is a great deal of uncertainty around how quickly this might happen. The EIA sought to clarify, noting that the markets have confused some of its storage figures – some oil supplies in the EIA’s weekly inventory data is actually sitting in pipelines and at well sites, meaning there is more storage capacity available than many news outlets had originally thought. An EIA analyst recently told Bloomberg that overall storage capacity is only at about 60 percent, and “[w]e still have a way to go before we can consider ourselves to be full,” Rob Merriam, EIA’s head of petroleum statistics said. It would take a few months of strong inventory builds to fill up the remaining storage, perhaps an unlikely scenario, especially if production starts to take a hit. But if storage tanks did start to fill up, prices would dive once again and companies would have to shut in wells and cut back on production.
Rig counts are at six year lows, forcing oil prices up on speculation that supply reductions will soon relieve the oil glut. But a double dip cannot be ruled out.
Source
The surge in shale production has produced a temporary glut in supplies causing oil prices to experience a massive bust. After tanking to a low of $44 per barrel in January, falling rig counts and enormous reductions in exploration budgets have fueled speculation that the market will correct sometime later this year.
However, there is a possibility that the recent rise to $51 for WTI and $60 for Brent may only be temporary. In fact, several trends are conspiring to force prices down for a second time.
Drillers are consciously deciding to delay the completion of their wells, holding off in hopes that oil prices will rebound, according to E&E’s EnergyWire. The decision to put well completions on hold could provide a critical boost to the ultimate profitability of many projects. Higher oil prices in the months ahead will provide companies with more money for each barrel sold. But also, with the bulk of a given shale well’s lifetime production coming within the first year or two, it becomes all the more important to bring a well online when oil prices are favorable. With prices still depressed – WTI is hovering just above $50 per barrel – drillers are waiting for sunnier days.
Yet another reason to wait is the possibility that costs for well completions will decline. Oil and gas companies often contract out well completions to third parties, and those companies will face pressure to cut their fees in order to keep business. That works in favor of producers who put their projects on hold for the time being. Well completions can make up as much as three-quarters of the total project cost.
Several prominent shale drillers have confirmed they are undertaking such a wait-and-see strategy. EOG Resources, one of the biggest Texas shale drillers, announced its plans in late February to hold off on completions. Chesapeake Energy and Continental Resources have now followed suit.
“We’re intentionally holding production back in 2015, because we believe it’s the prudent thing to do,” Doug Lawler, Chesapeake’s CEO, said in a conference call. Chesapeake has said it may delay completing as many as 100 wells. EOG has 200 wells awaiting completion, a backlog that will intentionally rise to about 350 this year.
As the industry clears out that queue of wells awaiting completion, a rush of new supplies could come online, pushing WTI prices down once again.
Even with well completions being suspended, supplies continue to build. The latest EIA data shows that oil stocks in the United States climbed to 434 million barrels, the highest levels in storage in over 80 years. “My gut feeling is that the oil price could see a double bottom,” Jason Kenney, an analyst with Banco Santaander SA said in a Bloomberg interview. “We’ve got too much inventory.”
Bloomberg noted that Kenney has a good track record of predicting price swings in the past. Even though rig counts have declined significantly, output has so far proved resilient.
Finally, there is some evidence that the ability to move excess oil into storage may run into trouble if production does not decline. Storage tanks are starting to fill, raising the possibility that a glut could worsen. There is a great deal of uncertainty around how quickly this might happen. The EIA sought to clarify, noting that the markets have confused some of its storage figures – some oil supplies in the EIA’s weekly inventory data is actually sitting in pipelines and at well sites, meaning there is more storage capacity available than many news outlets had originally thought. An EIA analyst recently told Bloomberg that overall storage capacity is only at about 60 percent, and “[w]e still have a way to go before we can consider ourselves to be full,” Rob Merriam, EIA’s head of petroleum statistics said. It would take a few months of strong inventory builds to fill up the remaining storage, perhaps an unlikely scenario, especially if production starts to take a hit. But if storage tanks did start to fill up, prices would dive once again and companies would have to shut in wells and cut back on production.
Rig counts are at six year lows, forcing oil prices up on speculation that supply reductions will soon relieve the oil glut. But a double dip cannot be ruled out.
Source
March 3, 2015
Stock Market Bubble: Wall Street Is Ecstatic As The NASDAQ Closes Above 5000
Are we at the tail end of the stock market bubble to end all stock market bubbles? Wall Street was full of glee Monday when the Nasdaq closed above 5000 for the first time since the peak of the dotcom bubble in March 2000. And almost everyone in the financial world seems convinced that things are somehow “different” this time around. Even though by almost every objective measure stocks are wildly overpriced right now, and even though there are a whole host of signs that economic trouble is on the horizon, the overwhelming consensus is that this bull market is just going to keep charging ahead. But of course that is what they thought just before the last two stock market crashes in 2001 and 2008 as well. No matter how many times history repeats, we never seem to learn from it.
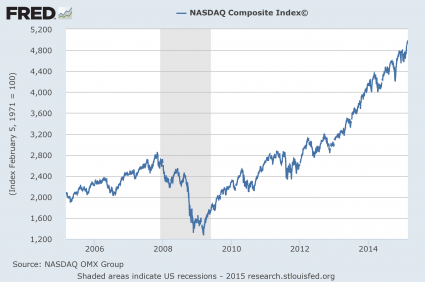
Back in October 2002, the Nasdaq hit a post-dotcom bubble low of 1108. From there, it went on an impressive run. In late 2007, it briefly moved above 2800 before losing more than half of its value during the stock market crash of 2008.
So the fact that the Nasdaq has now closed above 5000 is a really big deal. The following is how USA Today described what happened on Monday…
By looking at that chart, you would be tempted to think that the overall U.S. economy must be doing great.
But of course that is not the case at all.
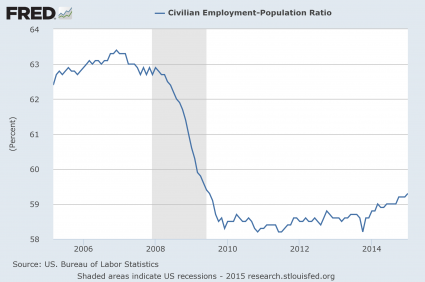
For example, just take a look at what has happened to the employment-population ratio over the past decade. The percentage of the working age U.S. population that is currently employed is actually far lower than it used to be…
So why is the stock market doing so well if the overall economy is not?
Well, the truth is that stocks have become completely divorced from economic reality at this point. Wall Street has been transformed into a giant casino, and trading stocks has been transformed into a high stakes poker game.
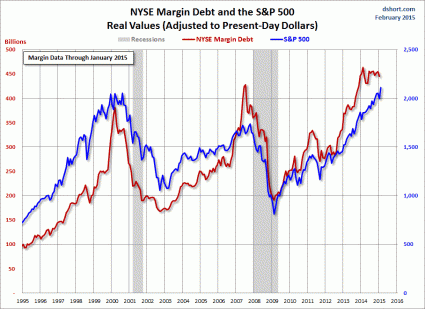
And one of the ways that we can tell that a stock market bubble has formed is when people start borrowing massive amounts of money to invest in stocks. As you can see from the commentary and chart from Doug Short below, margin debt is peaking again just like it did just prior to the last two stock market crashes…
We are in the midst of a monumental stock market bubble and most on Wall Street seem willingly blind to it.
Fortunately, there are a few sober voices in the crowd. One of them is John Hussman. He is warning that now is the time to get out of stocks…
At some point the bubble is going to burst.
If you want to know what the real economy is like, just ask Alison Norris of Detroit, Michigan…
It would be one thing if the stock market was soaring because the U.S. economy was thriving.
But we all know that is not true.
So that means the current stock market mania that we are witnessing is artificial.
How long will it last?
Source
Back in October 2002, the Nasdaq hit a post-dotcom bubble low of 1108. From there, it went on an impressive run. In late 2007, it briefly moved above 2800 before losing more than half of its value during the stock market crash of 2008.
So the fact that the Nasdaq has now closed above 5000 is a really big deal. The following is how USA Today described what happened on Monday…
The Nasdaq Composite capped its long march back to 5000 Monday, eclipsing, then closing above the long-hallowed mark for the first time since March 2000.The chart below shows how the Nasdaq has performed over the past decade. As you can see, we are coming dangerously close to doubling the peak that was hit just before the last stock market collapse…
The arduous climb came on the heels of a 10-day winning streak that ended last week, Nasdaq’s longest since July 2009. That helped fuel the technology-heavy market index to a 7% gain in February, the sixth-largest monthly climb since its 1971 launch.
By looking at that chart, you would be tempted to think that the overall U.S. economy must be doing great.
But of course that is not the case at all.
For example, just take a look at what has happened to the employment-population ratio over the past decade. The percentage of the working age U.S. population that is currently employed is actually far lower than it used to be…
So why is the stock market doing so well if the overall economy is not?
Well, the truth is that stocks have become completely divorced from economic reality at this point. Wall Street has been transformed into a giant casino, and trading stocks has been transformed into a high stakes poker game.
And one of the ways that we can tell that a stock market bubble has formed is when people start borrowing massive amounts of money to invest in stocks. As you can see from the commentary and chart from Doug Short below, margin debt is peaking again just like it did just prior to the last two stock market crashes…
Unfortunately, the NYSE margin debt data is a month old when it is published. Real (inflation-adjusted) debt hit its all-time high in February 2014, after which it margin declined sharply for two months, but by June it had risen to a level about two percent below its high and then oscillated in a relatively narrow range. The latest data point for January is four percent off its real high eleven month ago.
So why can’t more people see this?
We are in the midst of a monumental stock market bubble and most on Wall Street seem willingly blind to it.
Fortunately, there are a few sober voices in the crowd. One of them is John Hussman. He is warning that now is the time to get out of stocks…
Unless we observe a rather swift improvement in market internals and a further, material easing in credit spreads – neither which would relieve the present overvaluation of the market, but both which would defer our immediate concerns about downside risk – the present moment likely represents the best opportunity to reduce exposure to stock market risk that investors are likely to encounter in the coming 8 years.
Last week, the cyclically-adjusted P/E of the S&P 500 Index surpassed 27, versus a historical norm of just 15 prior to the late-1990’s market bubble. The S&P 500 price/revenue ratio surpassed 1.8, versus a pre-bubble norm of just 0.8. On a wide range of historically reliable measures (having a nearly 90% correlation with actual subsequent S&P 500 total returns), we estimate current valuations to be fully 118% above levels associated with historically normal subsequent returns in stocks. Advisory bullishness (Investors Intelligence) shot to 59.5%, compared with only 14.1% bears – one of the most lopsided sentiment extremes on record. The S&P 500 registered a record high after an advancing half-cycle since 2009 that is historically long-in-the-tooth and already exceeds the valuation peaks set at every cyclical extreme in history but 2000 on the S&P 500 (across all stocks, current median price/earnings, price/revenue and enterprise value/EBITDA multiples already exceed the 2000 extreme). Equally important, our measures of market internals and credit spreads, despite moderate improvement in recent weeks, continue to suggest a shift toward risk-aversion among investors. An environment of compressed risk premiums coupled with increasing risk-aversion is without question the most hostile set of features one can identify in the historical record.Everyone knows that the stock market cannot stay detached from economic reality forever.
At some point the bubble is going to burst.
If you want to know what the real economy is like, just ask Alison Norris of Detroit, Michigan…
When Alison Norris couldn’t find work in Detroit, she searched past city limits, ending up with a part-time restaurant job 20 miles away, which takes at least two hours to get to using public transportation.
Norris has to take two buses to her job at a suburban mall in Troy, Michigan, using separate city and suburban bus systems.
For many city residents with limited skills and education, Detroit is an employment desert, having lost tens of thousands of blue-collar jobs in manufacturing cutbacks and service jobs as the population dwindled.Sadly, her story is not an anomaly. I get emails from readers all the time that are out of work and just can’t seem to find a decent job no matter how hard they try.
It would be one thing if the stock market was soaring because the U.S. economy was thriving.
But we all know that is not true.
So that means the current stock market mania that we are witnessing is artificial.
How long will it last?
Source
March 2, 2015
Are Central Banks Creating Deflation?
Last week we noted that with the start of Q€ just around the corner, the ECB finds itself in a rather absurd situation. In what we called the ultimate easy money paradox (or, alternatively, the ultimate Keynesian boondoggle), Mario Draghi and crew are doomed to trip over their own policies as they (literally) attempt to monetize twice the net supply of eurozone fixed income this year.
The problem is two-fold: 1) the central bank’s adventures in NIRP-dom mean anyone willing to sell their EGBs would face the truly silly prospect of sending the proceeds right back where they came from, except at a cost of 20 bps (negative deposit facility rate), and 2) because the central bank’s easy money policies have compressed credit spreads, sellers who wanted to reinvest the cash they would theoretically receive for their EGBs would have to do so at ridiculously low rates, a scenario that would compound QE’s already negative effect on NIM for banks and would be absolutely untenable for insurers. So what we have “is one deflation-fighting policy stymying another [and] the central bank’s previous efforts to drive down rates thwarting its current plans to … drive down rates.”
Now, courtesy of Citi’s Matt King, it’s our distinct pleasure to present yet another wonderfully ridiculous paradox inadvertently created by central banks who apparently aren’t capable of understanding when they’re just pushing on a string: manufactured deflation or, more poignantly, just what the doctor did not order. Here’s Citi:

And so, stuck as we are in what looks like a chronic condition of oversupply and as it increasingly appears, in King’s words, that “the decoupling between EM GDP growth and global trade growth over the past decade [now looks] less like a benign shift away from exports to domestic consumption, and more like a world where GDP was temporarily boosted by a surge in credit, where suppliers ramped up capacity in anticipation of 10% nominal EM/Chinese demand growth continuing indefinitely, but where the limits of such credit-fuelled demand are suddenly being exposed,” more QE simply won’t move inflation expectations and certainly can’t do much to further stimulate aggregate demand (assuming it’s done anything in that regard thus far).
In other words, we’ve reached the limit of what can be accomplished and with NIRP creating new market perversions on an almost daily basis, the unintended consequences of continuing to delve deeper into the new paranormal are making the game ever more dangerous as we now have central banks accidentally creating deflation while simultaneously embedding enormous amounts of risk in fixed income markets by sapping every last vestige of liquidity.
Soon enough, expect the rest of the world’s central banks to one by one meet their own Waterloos just as the SNB did in January. In fact, the ECB is on its way there now as it appears everyone is coming to realize that Q€ simply cannot work as designed. On that note, we’ll give the last (rather depressing) word to King:
The problem is two-fold: 1) the central bank’s adventures in NIRP-dom mean anyone willing to sell their EGBs would face the truly silly prospect of sending the proceeds right back where they came from, except at a cost of 20 bps (negative deposit facility rate), and 2) because the central bank’s easy money policies have compressed credit spreads, sellers who wanted to reinvest the cash they would theoretically receive for their EGBs would have to do so at ridiculously low rates, a scenario that would compound QE’s already negative effect on NIM for banks and would be absolutely untenable for insurers. So what we have “is one deflation-fighting policy stymying another [and] the central bank’s previous efforts to drive down rates thwarting its current plans to … drive down rates.”
Now, courtesy of Citi’s Matt King, it’s our distinct pleasure to present yet another wonderfully ridiculous paradox inadvertently created by central banks who apparently aren’t capable of understanding when they’re just pushing on a string: manufactured deflation or, more poignantly, just what the doctor did not order. Here’s Citi:
Ultimately, the question is whether the ceaseless printing of money is actually creating any demand, and for King, the answer is pretty clearly “no”:It’s that linkage between investment (or the lack of it) and all the stimulus which we find so disturbing. If the first $5tn of global QE, which saw corporate bond yields in both $ and € fall to all-time lows, didn’t prompt a wave of investment, what do we think a sixth trillion is going to do?
Another client put it more strongly still. “By lowering the cost of borrowing, QE has lowered the risk of default. This has led to overcapacity (see highly leveraged shale companies). Overcapacity leads to deflation. With QE, are central banks manufacturing what they are trying to defeat?”
This point is nicely illustrated by Citi in the following two charts (from a previous note) showing the evolution of inflation expectations over the last several years:QE, and stimulus generally, is supposed to create new demand, improving capacity utilization, not reducing it. But ... it feels ever more as though central bank easing is just shifting demand from one place to another, not augmenting it.
And so, stuck as we are in what looks like a chronic condition of oversupply and as it increasingly appears, in King’s words, that “the decoupling between EM GDP growth and global trade growth over the past decade [now looks] less like a benign shift away from exports to domestic consumption, and more like a world where GDP was temporarily boosted by a surge in credit, where suppliers ramped up capacity in anticipation of 10% nominal EM/Chinese demand growth continuing indefinitely, but where the limits of such credit-fuelled demand are suddenly being exposed,” more QE simply won’t move inflation expectations and certainly can’t do much to further stimulate aggregate demand (assuming it’s done anything in that regard thus far).
In other words, we’ve reached the limit of what can be accomplished and with NIRP creating new market perversions on an almost daily basis, the unintended consequences of continuing to delve deeper into the new paranormal are making the game ever more dangerous as we now have central banks accidentally creating deflation while simultaneously embedding enormous amounts of risk in fixed income markets by sapping every last vestige of liquidity.
Soon enough, expect the rest of the world’s central banks to one by one meet their own Waterloos just as the SNB did in January. In fact, the ECB is on its way there now as it appears everyone is coming to realize that Q€ simply cannot work as designed. On that note, we’ll give the last (rather depressing) word to King:
SourceBy definition, races to the bottom are not very positive affairs. And as the sell-off in commodities shows, at some point they can lead to casualties. But the lower yields go, the longer even previously unsustainable debt burdens can be sustained – just look at Japan. Competitive easing may do little to improve long-term growth prospects, but it should make the hunt for yield more powerful still. Even if QE does prove deflationary, until we start running into actual defaults, it is hard to see what stops this.
February 27, 2015
Greenspan: "The Stock Market Is Great", But The Economy Feels Like In "The Late Stages Of The Great Depression"
While conflicting economic data leaves hope for both buills and bears, Alan Greenspan warns that, unlike Yellen, "US economic growth is not strong." He then slays another pillar - suggesting the exuberant job growth is anything but (as he focuses on weak productivity as he pinpoints entitlements as "crowding out capital investment" in America. The maestro then breaks the golden rule of central bankers and explains how The Fed was, in fact, the main driver of the P/E multiple expansion in stocks; and when asked if this ends as badly as last time? He concludes "It depends...When real interest rates start to move up, that's when the crisis could hit." The interview is somewhat stunning in its honesty (for a central banker) as he warns global "effective demand is extraordinarily weak - tantamount to the late stages of the great depression."
Some other excerpts...
And finally:

Some other excerpts...
Greenspan..."Lower long-term rates is not a conundrum, its an indication of how weak global economic growth is."
"effective demand is extraordinarily weak - tantamount to the late stages of the great depression."
"Monetary policy is not responsible for economic weakness - it's a fiscal issue."
The Fed is responsible for the inflation of the stock market
"Almost all the problems are due to a lack of long-term capital investment" - reflecting perfectly on our detailed explanations of company's preference for shareholder enhancement through buybacks rather than investing in the corporate growth of the economy... "nobody wants to invest in the long-term because nobody knows what is going to happen."
And finally:
You are right Alan..."Stock market is great - the economy is not."

February 26, 2015
Is This The Most Important Chart For The Future Of The World's Reserve Currency?
When it comes to the future of the dollar status as the world's reserve currency, the most important chart may be the fact that the US is now so woefully buried in debt that another global military conflict appears inevitable...

... or that it now takes virtually unlimited monetization of the debt shown above to preserve the illusion that the US is not bankrupt, pushing the S&P to record highs in the process...

... or that the marginal impact of every additional dollar in new debt generates increasingly less economic growth?

Indeed, the "most important chart" may very well be any of the above, but in our view the one chart which, both literally and metaphorically, will determine how much longer the USD will reign as the world's reserve, is the following.

Source

... or that it now takes virtually unlimited monetization of the debt shown above to preserve the illusion that the US is not bankrupt, pushing the S&P to record highs in the process...

... or that the marginal impact of every additional dollar in new debt generates increasingly less economic growth?
Indeed, the "most important chart" may very well be any of the above, but in our view the one chart which, both literally and metaphorically, will determine how much longer the USD will reign as the world's reserve, is the following.
Source
Subscribe to:
Posts (Atom)